
Figure 5.
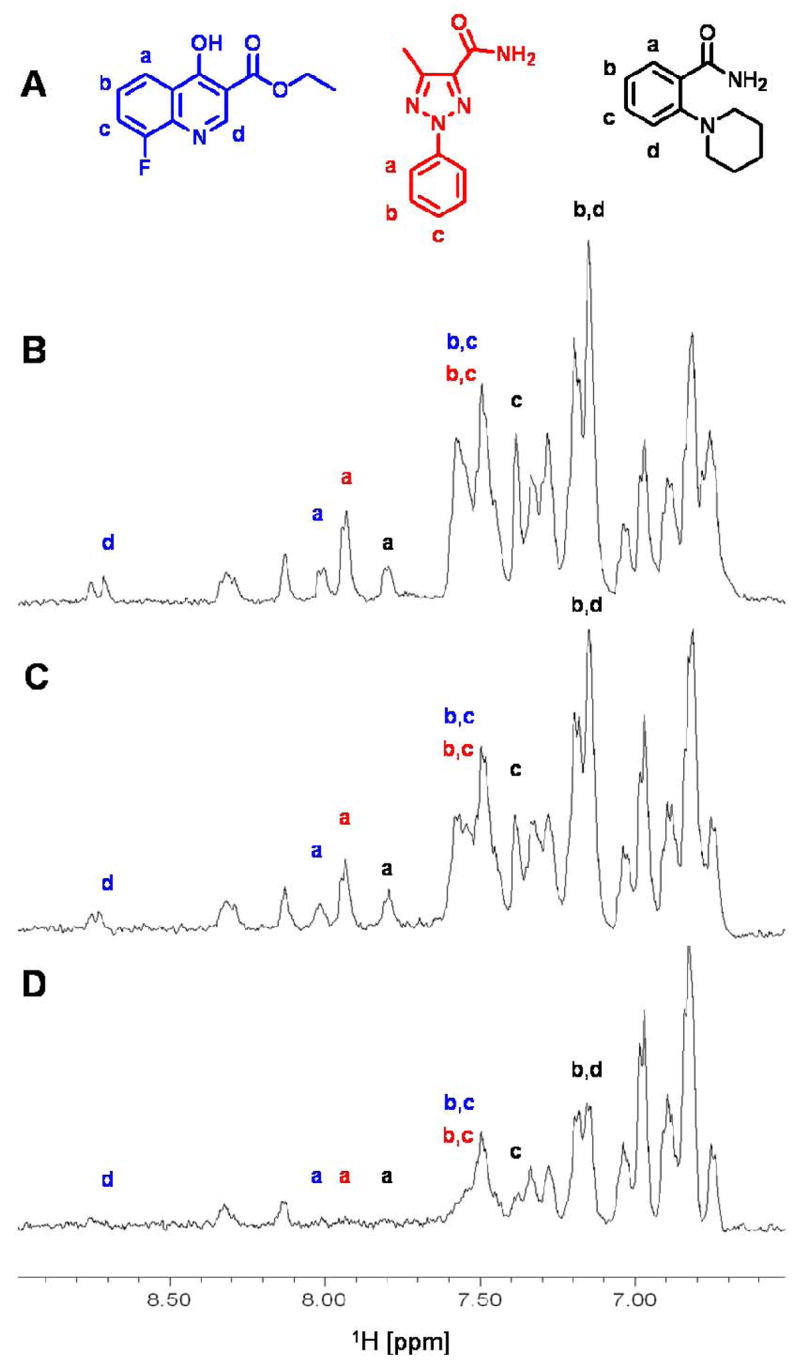
Example of second site binders (A) discovered by using compound 3 as spin-labeled probe. The aromatic region of 1D T1ρ spectra of a mixture of 10 compounds (1 mM each) are reported: B) in the presence of 500 μM of compound 3; C) in the presence of 10 μM of GST-YopH; and, D) in the presence of both 500 μM of compound 3 and 10 μM of GST-YopH. Letters indicate resonances from the compounds shown in panel A in corresponding colors. The additional peak shown around 8.7 ppm comes from an analogue of the quinoline compound (blue in panel A) present in the mixture.