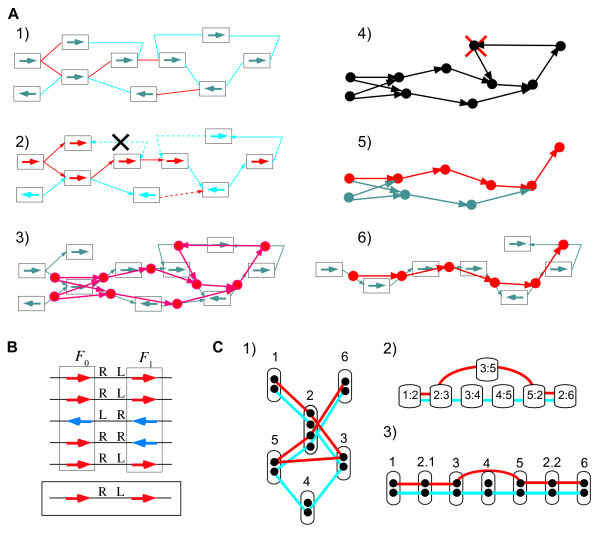
Figure 10.
The procedure for constructing a core genome alignment. (A) Overview of the procedure, which consists of the following steps: (1) Initial conserved neighborhood graph. The color of each edge (red or blue) indicates that two genes incident to it are in the same or opposite directions, respectively. (2) Assignment of a consistent orientation based on the MST. The edges included in the MST are drawn with sold lines, and other edges are drawn with broken lines. The node colors represent node directions, Dir(F). The edges are directed according to the resulting orientation, except the edge indicated by the X mark that cannot be assigned a consistent orientation; vertices incident to a blue edge should be in opposite directions (assigned different colors) in a consistent orientation. (3) Conversion of the original graph (gray) to the triplet graph (red). (4) Elimination of loops. The eliminated vertex is indicated by the X mark. (5) Identification of the maximum path of the graph. The maximum path is indicated in red. (6) Restoration of the original graph and construction of the genome alignment. (B) Determination of the representative relative direction between two neighboring OGs, F0 and F1, by majority vote. (C) An example of conversion of an original neighborhood graph to a triplet graph. (1) A neighborhood graph comprising six nodes (OGs) and seven edges. The red and blue lines indicate the two genomes used to construct the graph. Node 2 contains two (in)paralogous lineages that cause loop formation. (2) A triplet graph resulting from the conversion of graph (1). Note that the graph contains no loop. (3) A neighborhood graph resulting from a conversion back from the triplet graph (2). Note that node 2 is divided into two nodes.

