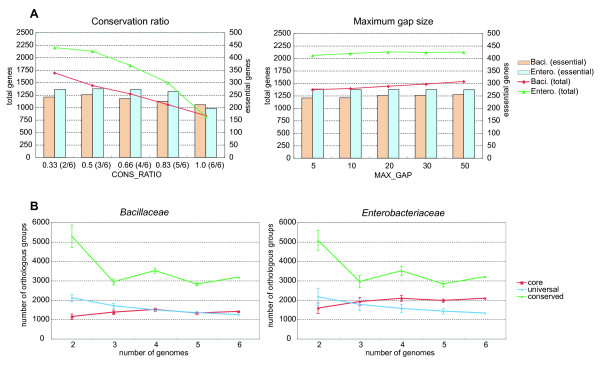
Figure 6.
Results of the parameter dependency test and the robustness test. (A) The parameter dependency test. The total number of OGs (line, left axis) and the number of essential genes (bar, right axis) included in the core set generated from the Bacillaceae (red lines and peach bars) and Enterobacteriaceae (green lines and light blue bars) datasets are shown for each parameter value of the conservation ratio (left) and allowed gap size (right). (B) The robustness test. The average number of structural core (red), universally conserved (green) and ≥ 50% conserved (blue) OGs for each number of input genomes in the test datasets that are generated as subsets of the original dataset of Bacillaceae (left) and Enterobacteriaceae (right). The error bars show the standard deviations.

