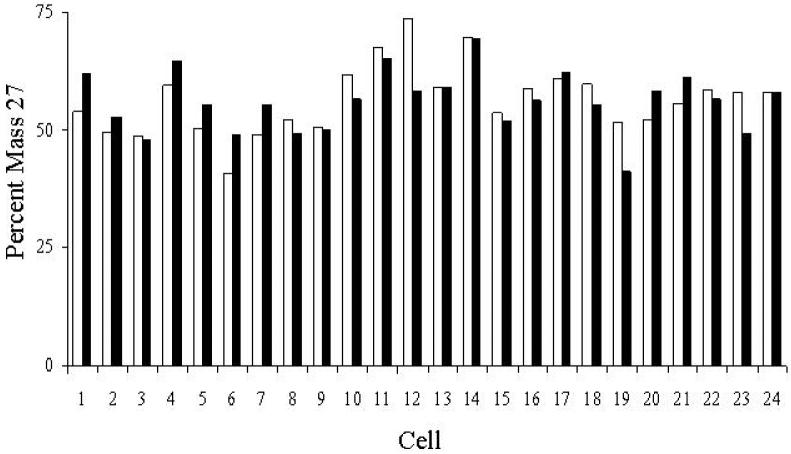
Figure 1.
A comparison of the change in mass 27 and mass 26 signal intensities detected by SIMS in P. putida NCIB 9816-4 cells grown on 13C-glucose after exposure to the O2+ beam for 4.5 min. The percent mass 27 for each cell was calculated from signal intensities from an initial measurement of mass 27 and 26 ions (white bars) and signal intensities from a subsequent measurement after 4.5 minutes of exposure to the O2+ beam (black bars). Image analysis was performed using DIP station software.

