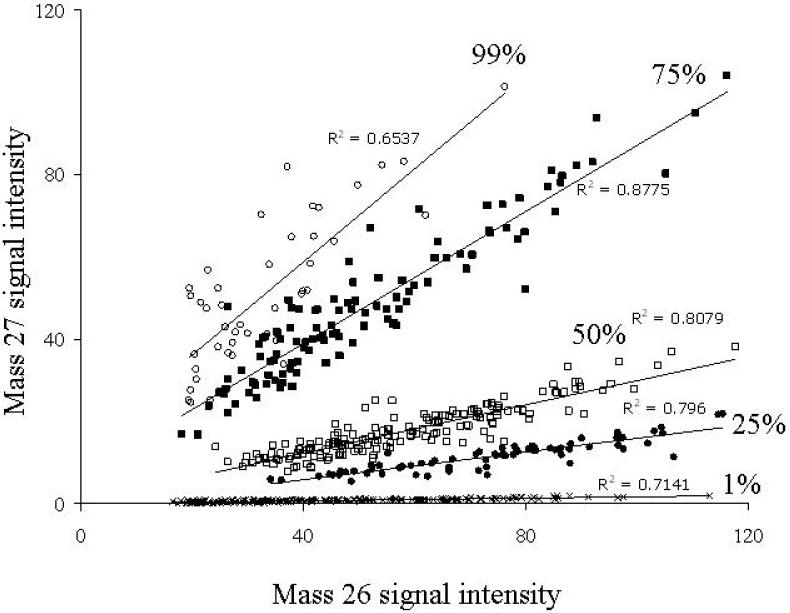
Figure 2.
A scatter plot showing the relationship between mass 27 and mass 26 signal intensities from individual cells of P. putida NCIB 9816-4 grown on 1 g· L−1 total glucose while varying the proportion of 13C label from 99 to 75, 50, 25, or 1%. Each data point represents an individual bacterial cell whose mass 27 and mass 26 signals were determined using SIMS. Up to 200 determinations were completed for each growth condition. Images were recorded by dynamic SIMS ion microscopy and signal intensities were measured with Metamorph® software.

