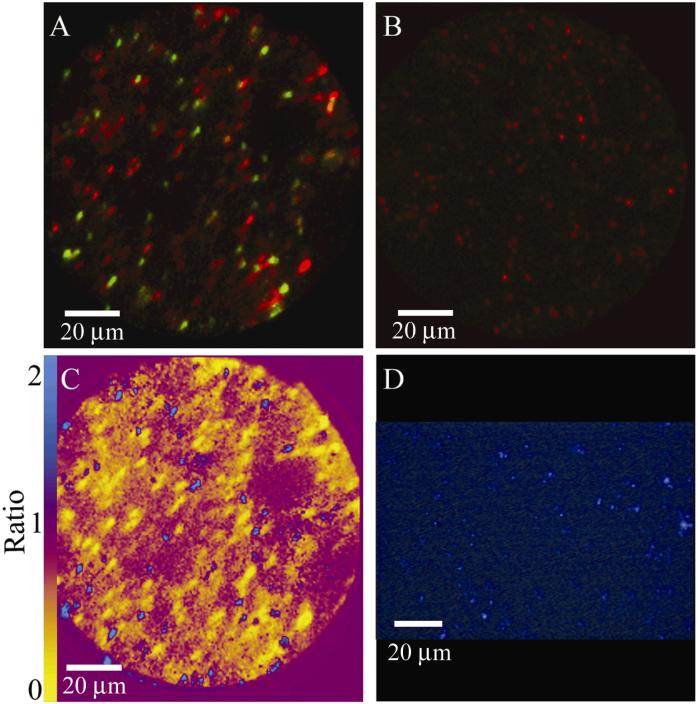
Figure 6.
A comparison of mass 27 and mass 26 SIMS images. Mass 27 (green) to mass 26 (red) overlay of field samples dosed with (A) 13C-phenol or (B) 12C-phenol. (C) Mass 27 to 26 ratio image of the same 13C-phenol exposed soil. (D) DAPI image, 40x magnification, of comparable soil sample not exposed to the O2+ beam.

