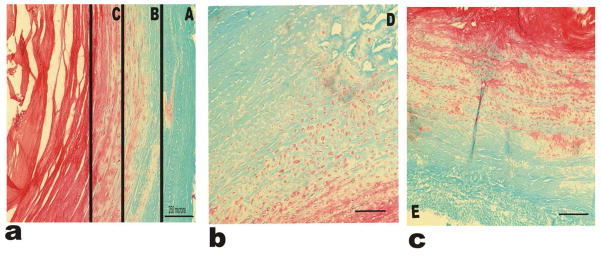
Figure 10.
Histological analysis using Saffranin-Orange and Fast Green stains for the IVD-AF regions. (a) Shows regions A, B and C; (b) and (c) represent regions D and E respectively. Saffranin Orange stain binds to GAG chains in PGs. All sections show clear gradient behavior among the PG content within the tissue. Magnification used 10X.

