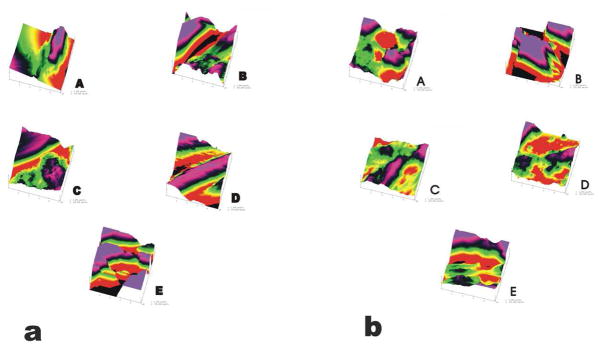
Figure 3.
Reconstructed images from AFM raw data using Nanoscope IIIa software. Surface topographical analysis showed mainly rough surfaces. Details of scanning surfaces (cell or matrix) could not be distinguished in the reconstructed topographical images. Scan size 5×5 um. (a) Image gallery showing surface topography for axial scans of the regions A through E. (b) Image gallery showing surface topography for transverse scans of the regions A through E.

