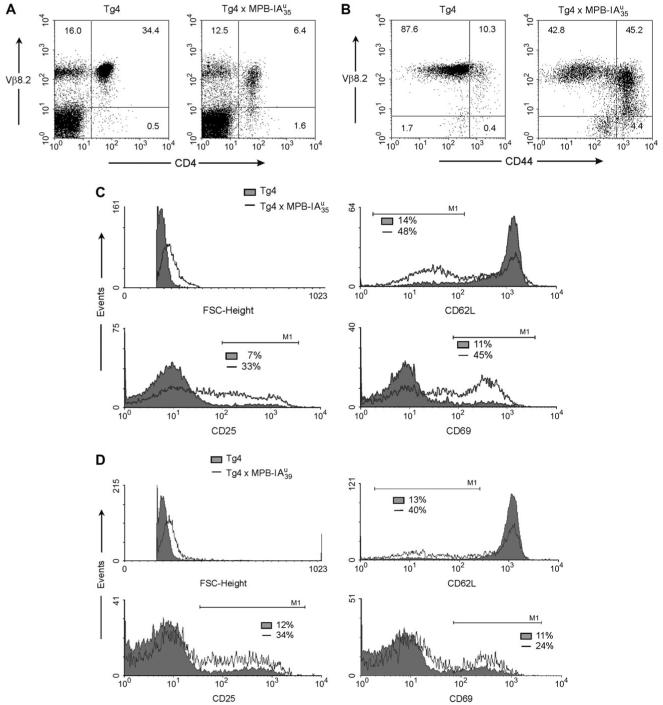
Fig. 4.
Reduced number and activation status of peripheral MBP-specific T cells in double transgenic mice. (A-D) FACS analysis of LN cells: (A) Reduction of peripheral CD4+ Tcells and down-regulation of the transgenic Vβ8.2 chain. Staining of Vβ8.2 against CD4. (B) Expression of CD44 on peripheral CD4 T cells. Staining of Vβ8.2 (F23.1-FITC), CD4 (CD4-613) and the activation marker CD44 (CD44-bio/SA-PE). The dot blots show Vβ8.2 against CD44 gated on CD4+ T cells. (C, D) The histograms show the expression of activation markers on CD4-positive, gated cells. Tg4 mice, filled; , empty (C) or , empty (D). Cells were stained for Vβ8.2 (F23.1-FITC), CD4 (CD4-613) and the respective activation marker with biotinylated antibodies followed by SA-PE staining. The numbers show the percentage of cells in the marker region of the respective histogram.

