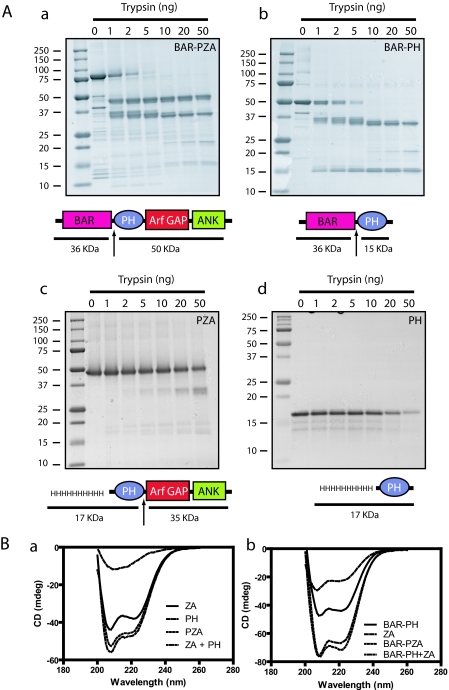
FIGURE 2.
Structural analysis of ASAP1. A, limited proteolysis of ASAP1 reveals flexible linker between the BAR and PH domains. Panel a, BAR-PZA. Panel b, BAR-PH. Panel c, PZA. 4 μm of the indicated proteins was incubated with the indicated mass of trypsin for 10 min at 30 °C in 20 mm Hepes, pH 7.4, 100 mm NaCl, 2 mm MgCl2, 1 mm GTP. The reaction was stopped with 200 ng of soybean trypsin inhibitor, and products were analyzed by electrophoresis using a 10–20% polyacrylamide gel. Panel d, PH. The experiment performed as in panels a, b, and c but an 18% polyacrylamide gel to visualize the smaller fragments generated from the PH domain. The cleavage sites are indicated by arrows in the schematics. B, CD spectra of ASAP1 recombinant proteins. The spectra of the indicated proteins alone and in combination are shown. The spectra of the larger recombinant proteins were, in each case, the sum of the spectra of the small recombinant proteins, indicating that the domains independently folded. Panel a, PZA, PH, and ZA. Panel b, BAR-PZA, BAR-PH, and ZA. mdeg, millidegrees.

