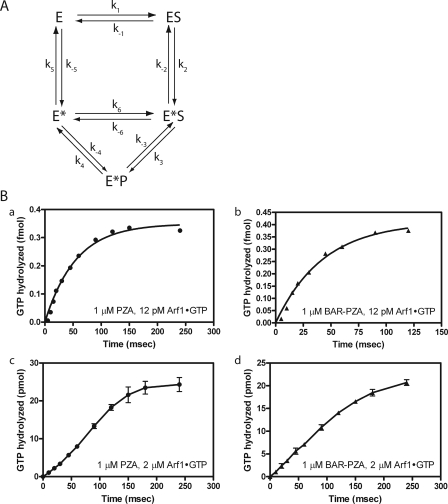
FIGURE 7.
Presteady kinetic analysis. A, reaction scheme with transition state intermediate that can bind substrate. This reaction scheme was the basis for the equations described under “Appendix.” E = ASAP1; S = Arf1·GTP; P = Arf1·GDP. B, comparison of ASAP1-catalyzed GTP hydrolysis with different substrate/enzyme ratios. Panels a and b, enzyme in excess of substrate. Single turnover kinetic analysis when PZA (1 μm) (panel a) or BAR-PZA (1 μm) (panel b) was in excess of substrate (12 pm) is shown. Panels c and d, substrate in excess of enzyme. An experiment similar to that in panels a and b except Arf·GTP concentration (2 μm) was in excess of PZA (panel c) or BAR-PZA (panel d) (1 μm). The data shown for panels c and d are the mean and S.E. for three experiments. The data shown for panels a and b are representative of four or more experiments.

