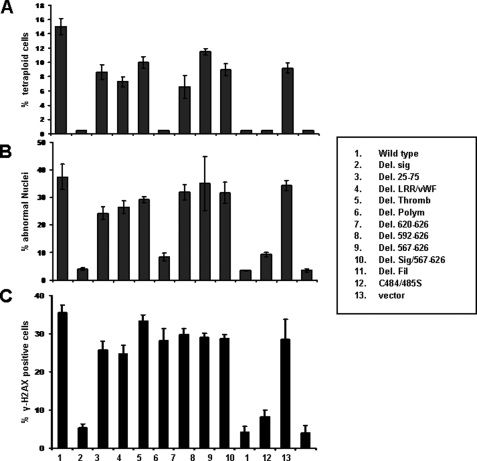
FIGURE 5.
Identification of GpIbα domains responsible for promoting GI. A, logarithmically growing Rat1a cells expressing the GpIbα proteins depicted in Fig. 2A were exposed to colcemid, and their DNA content was assessed by flow cytometry of propidium iodide-stained nuclei, as described previously (14, 16, 17). Tetraploid/aneuploid populations are included in the “8 n” population. Note that Rat1a-vector control cells demonstrate little, if any, evidence of tetraploidy/aneuploidy. Numbers are the average of triplicate determinations, and bars indicate ±1 S.E. See Fig. S3 for examples of actual propidium iodide profiles. B, quantification of nuclear abnormalities in Rat1a cells following DCB treatment. Rat1a cell lines were exposed to DCB for 24 h and were then stained with 4′,6-diamidino-2-phenylindole. The percentage of cells containing a single nucleus, two nuclei, or “abnormal nuclei” was then determined. In the last case, this group included cells with >2 nuclei, nuclei of unequal size and shape, micronuclei, or other abnormalities, such as chromosomal bridging. All determinations were based on counting at least 200 cells from randomly chosen fields. See Fig. S4 for examples of the various abnormalities seen in cells expressing full-length GpIbα and its active mutants. C, γ-H2AX staining. Logarithmically growing Rat1a cells were fixed in paraformaldehyde and stained for γ-H2Ax using an antibody against Ser-139 of histone H2A, as described previously (17). The percentage of positively staining cells was then determined based on counting >200 cells/sample from triplicate cultures. See Fig. S5 for examples of images from cell lines with detectable levels of γ-H2AX.

