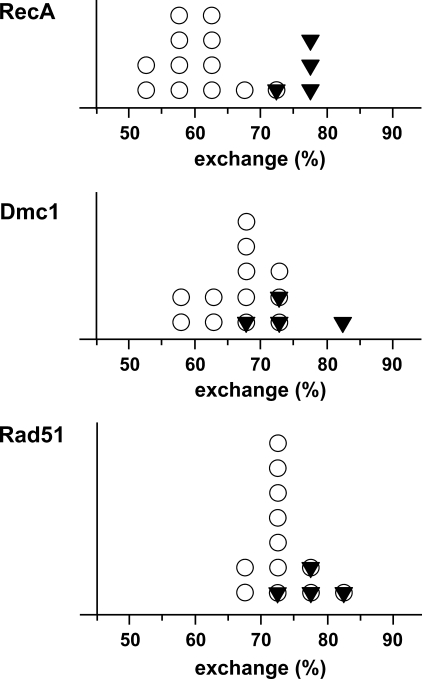
FIGURE 7.
Distribution of the yields of strand exchange reactions promoted by RecA protein and human recombinases. Each symbol corresponds to one entry in Table 2 for RecA and Table 3 for human recombinases and presents one of the 16 combinations of the reaction substrates with a reaction yield in a particular 5% interval. Open circles present exchanges between heterologous substrates (off the diagonal entries in Table 2 and 3); closed triangles, between completely homologous substrates (diagonal entries in Table 2 and 3).

