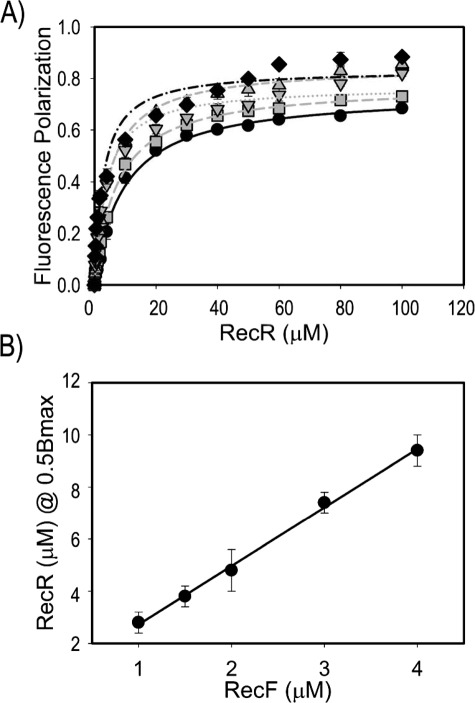
FIGURE 6.
Estimation of RecF-RecR stoichiometry using DNA binding fluorescence polarization assay. A, solutions with five different RecF and dsDNA concentrations were titrated with RecR. Data for 1μm RecF and dsDNA are shown by black diamonds, for 1.5 μm, by gray downward triangles, for 2 μm, by gray upright triangles, for 3μm, by gray squares, for 4μm, by black circles. The curves represent theoretical fitting calculated with SigmaPlot. B, concentrations of RecR necessary for half saturation of the RecF-dsDNA complex were plotted against the RecF concentrations and fitted by linear approximation.

