
Figure 3.
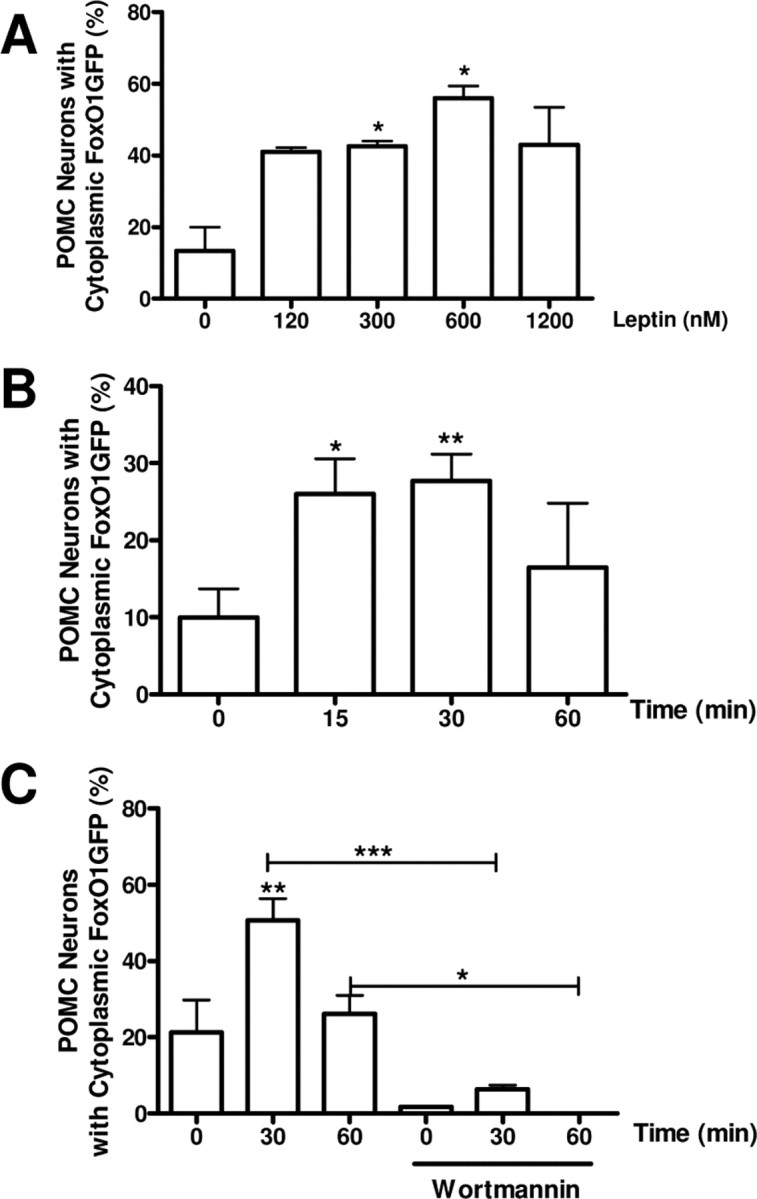
Effects of leptin on FoxO1GFP subcellular distribution. A, Slices expressing FoxO1GFP in POMC neurons were treated with increasing doses of leptin for 30 min. B, Time course of subcellular distribution of FoxO1GFP after exposure to 120 nm leptin. C, Inhibition of leptin-induced nuclear export of FoxO1GFP by wortmannin. Slices were pretreated with wortmannin (100 nm for 30 min), then followed by leptin stimulation (120 nm for indicated period). Subcellular localization of FoxO1GFP is plotted as the percentage of neurons with cytoplasmic FoxO1GFP as in Figure 2. **p < 0.01 and *p < 0.05, compared with control by unpaired Student's t test.