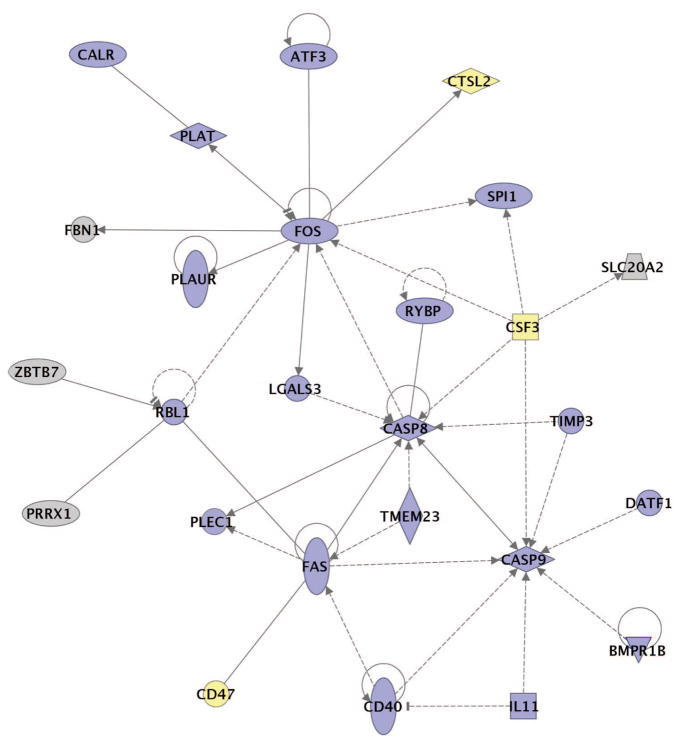
Figure 4. Functional relationships of activated of cell death responses during infection with r1918 influenza virus.
Biological network of selected genes that were only induced more than twofold (P < 0.01) in the r1918-infected mouse lung compared with uninfected controls. This diagram shows the direct (solid lines) and indirect (dashed lines) interactions reported for these cell-death-related (blue shading) and immune-response-related (yellow shading) genes; grey denotes genes with multiple and/or undefined biological functions. Biological network analysis was performed by using Ingenuity Pathway Analysis and showed statistical significance with Fisher’s exact test to calculate a P-value determining the probability that each biological function and/or disease assigned to that data set was due to chance alone (see Methods for details).

