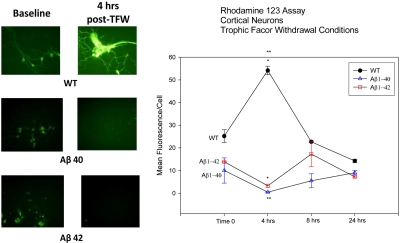
Figure 3.
Rhodamine 123 sequestration as a function of mitochondrial transmembrane potential. 1-week-old cortical neuronal cultures were challenged with TFW. At various time points after challenge (0 hrs, 4 hrs, 8 hrs and 24 hrs), culture plates were then exposed in vitro to the fluorescent mitochondrial probe, Rhodamine 123. The fluorescent signal from culture plates was imaged with photomicroscopy at 510 nm emission spectrum and analyzed off line. The images were evaluated using an image analysis software with fluorescent intensity quantified in arbitrary units. This analysis was finally utilized to plot the line graph (right half of the figure), displaying average fluorescent intensity per cell ± SEM. The images in the left half of the figure represent baseline activity (time 0 of TFW challenge) and 4 hours after TFW challenge (the time observed to have the most significant change from baseline levels). The three panels on the left (top, middle and bottom) are representative of baseline conditions for the three cell types (WT, Aβ40 and Aβ42). The panels on the right (top, middle and bottom) represent 4 hours post-TFW challenge. Statistical significance was observed between WT neurons and the transgenic cells at 4 hours post TFW challenge (p = <0.05). At this time point, differences between the two transgenic neuronal cultures did not reach statistical significance.

