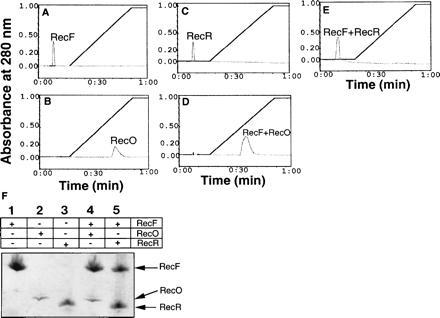
Figure 3.

Elution profiles of proteins bound to the Ssb affinity column: RecF (38 μM), RecO (56 μM), and RecR (68 μM) proteins in reaction buffer I were applied to an Ssb protein affinity column preequilibrated with the same buffer I. The column was washed and bound proteins were eluted in a linear gradient of salt to 1 M NaCl. To form complexes proteins as indicated were mixed in the buffer and incubated on ice for 30 min prior to applying on to the column. Total time taken to complete a run is given on the x axis. A, RecF; B, RecO; C, RecR; D, RecF–RecO; E, RecF–RecR. 3F: Peak fractions were analyzed by SDS/PAGE and proteins were visualized by Coomassie blue staining. Fractions corresponding to each peak are indicated. The RecO protein appears to stain less under these conditions.
