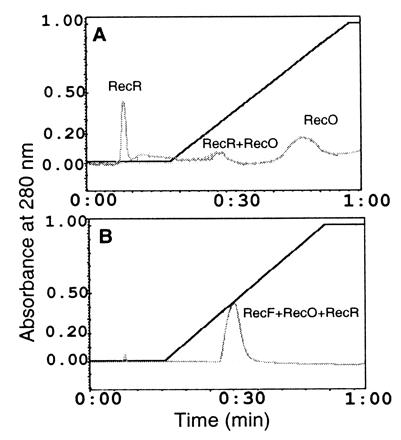
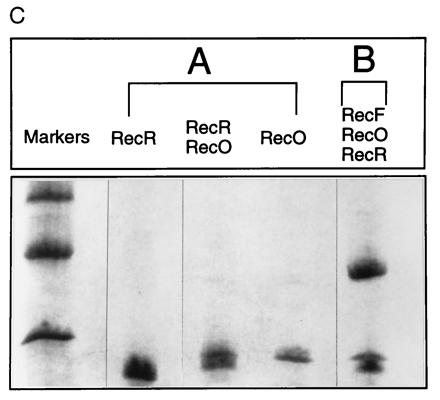
Figure 4.


RecO at 150 μg and RecR at 150 μg, which correspond to 56 μM and 68 μM, respectively, or RecF at 150 μg, RecO at 150 μg, and RecR at 150 μg, which correspond to 38 μM, 56 μM, and 68 μM, respectively, were mixed in buffer I, and incubated on ice for 30 min prior to applying on Ssb affinity column. Bound proteins were eluted in linear gradient of salt. (A) RecO–RecR complex on Ssb affinity column. (B) RecF–RecO–RecR complex on Ssb affinity column. (C) Peak fractions were analyzed by SDS/PAGE and proteins were visualized by Coomassie blue staining. (A) Peak fractions obtained when RecO–RecR was applied to the Ssb column. (B) The peak fraction obtained when the RecF–RecO–RecR complex was applied. Each lane represent proteins present in corresponding peak fractions.
