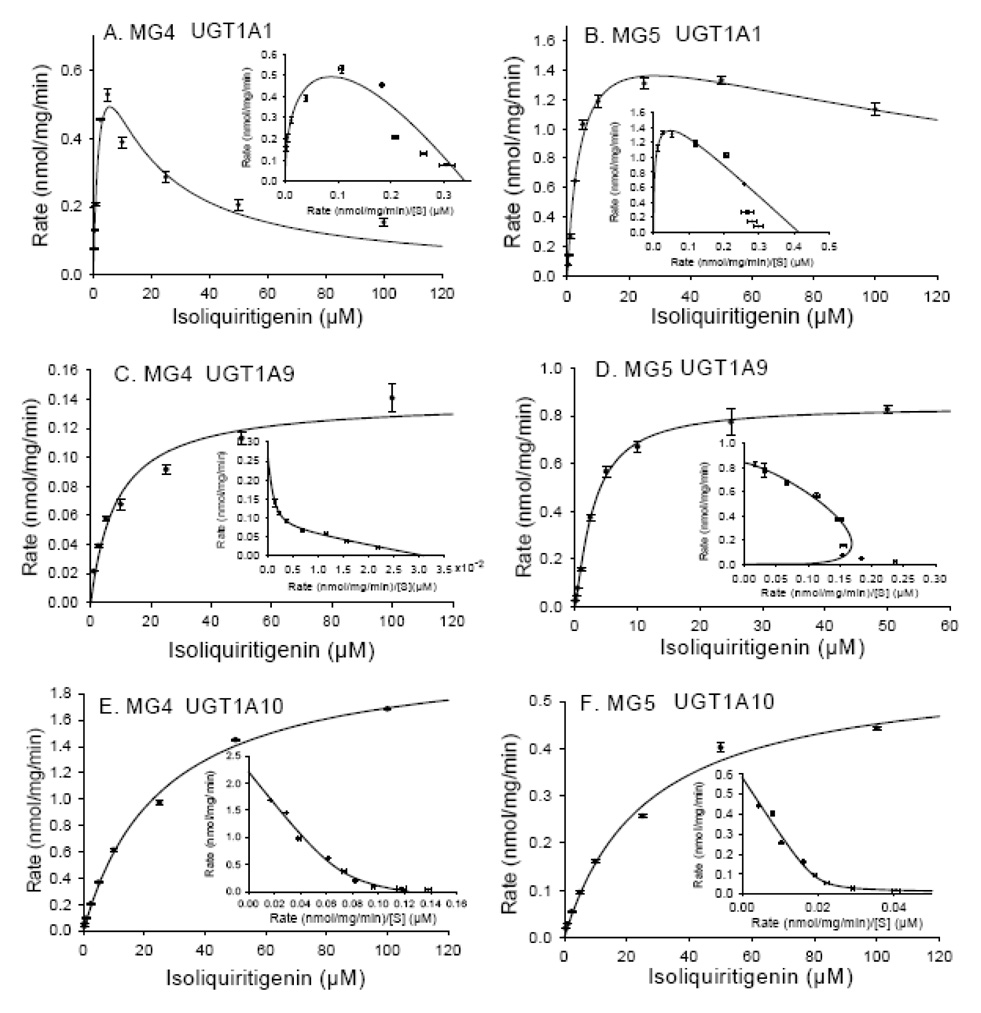
Figure 6.
Enzyme kinetics of MG4 and MG5 formation by (A and B) UGT1A1; (C and D) UGT1A9; and (E and F) UGT1A10. Eadie-Hofstee plots are shown as inserts on each graph. The solid lines represent the curve fit to the corresponding enzyme kinetic equation. The data represent the Mean ± Std. Error of triplicate measurements.

