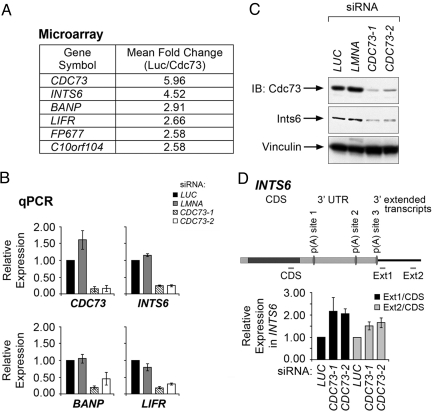
Fig. 3.
Cdc73 regulates the expression of Ints6. (A) Mean fold change for the genes whose expression was most significantly decreased upon knockdown of Cdc73, as assayed by 3 independent probe sets on Affymetrix U133A 2.0 arrays. (B) Expression of CDC73, INTS6, BANP, and LIFR was measured by quantitative real-time RT-PCR in HeLa cells transfected with siRNAs directed to either luciferase (LUC), lamin (LMNA), or CDC73 (CDC73-1, CDC73-2). Transcript levels were normalized to the LUC control. Error bars indicate SD for 3 independent experiments. (C) HeLa cells were transfected with the indicated siRNAs, and cell lysates were subjected to immunoblot analysis (IB) with the indicated antibodies. (D) (Upper) A scheme representing the INTS6 transcript and predicted poly(A) sites located 3,780 bp [p(A) site 1], 6,335 bp [p(A) site 2], and 7,431 bp [p(A) site 3] from the transcriptional start site. Expression of INTS6 transcript was measured by using quantitative real-time RT-PCR with the depicted CDS, Ext1 and Ext2 primers in HeLa cells transfected with the indicated siRNAs. (Lower) Level of extended transcript was calculated by normalizing Ext1 or Ext2 transcript levels to the CDS transcript level. Error bars indicate SEM for 3 independent experiments.

