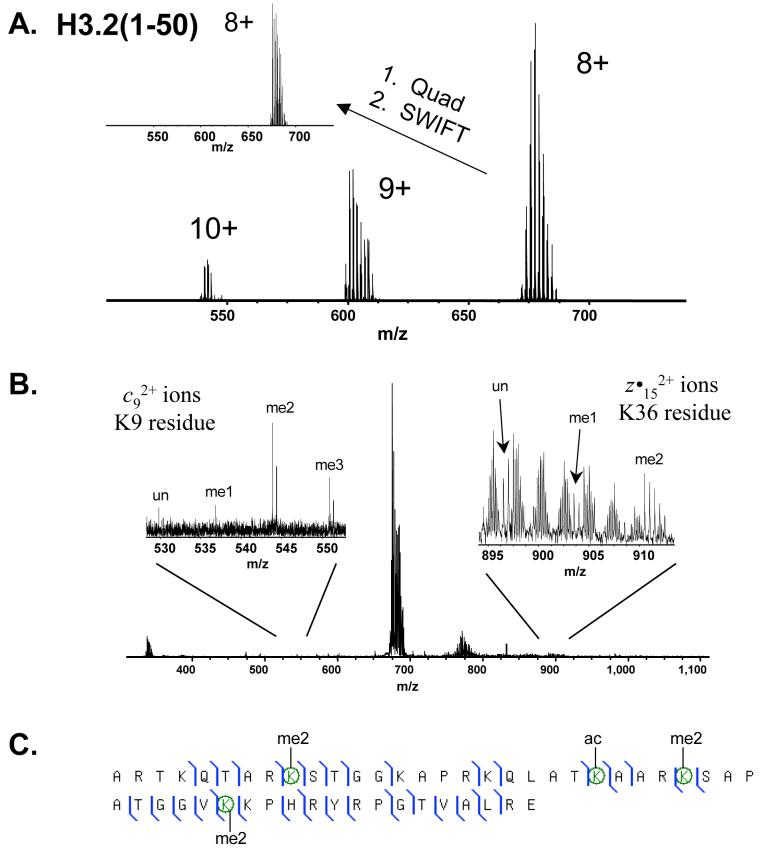
Figure 3.
A. Broadband mass spectrum of the 8+, 9+ and 10+ charge states of the histone H3.2(1-50) polypeptide from rat kidney. Further isolation of the 8+ charge state species is achieved through additional quadrupole enhancement and SWIFT isolation as shown in the inset mass spectrum. B. ECD fragmentation of the 8+ charge state species isolated in (A.). Zoom regions spanning 528-552 m/z and 895-912 m/z show regions containing fragment ions which correspond to posttranslational modifications on K9 (unmodified, mono-, di- and trimethylation) and K36 (unmodified, mono- and dimethylation), respectively. C. ECD fragment map generated from the fragmentation spectrum shown in (B.). Some of the most common modifications observed on histone H3.2 from rat kidney are K9me2K23acK27me2K36me2.

