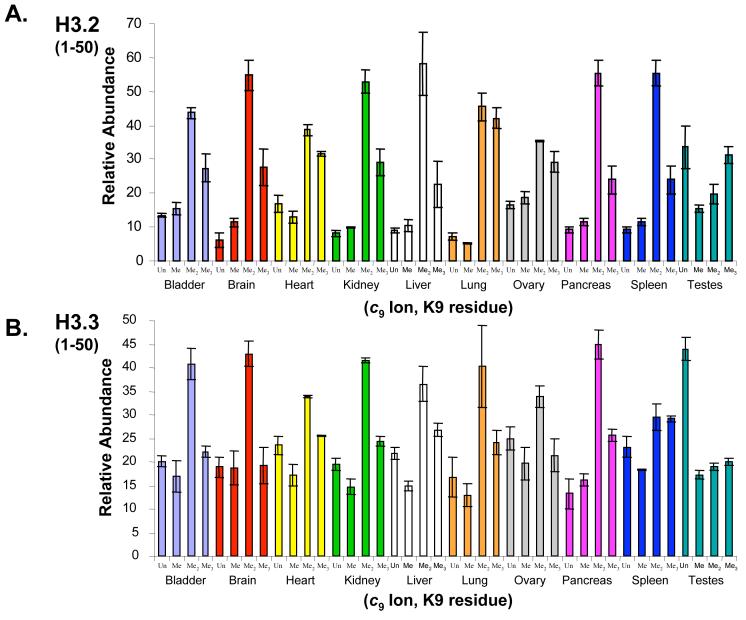
Figure 5.
Histograms showing the comparison of K9 modifications (unmodified, mono-, di- and trimethylation) observed in ECD generated c92+ ions (FIRRs) from the (A.) H3.2(1-50) and (B.) H3.3(1-50) polypeptides for all ten rat tissues as labeled. Fractional occupancy was determined from ECD spectra produced from the 8+ charge state species. Histograms depict the average of three independent biological samples (N=3) and standard deviations are shown as error bars.

