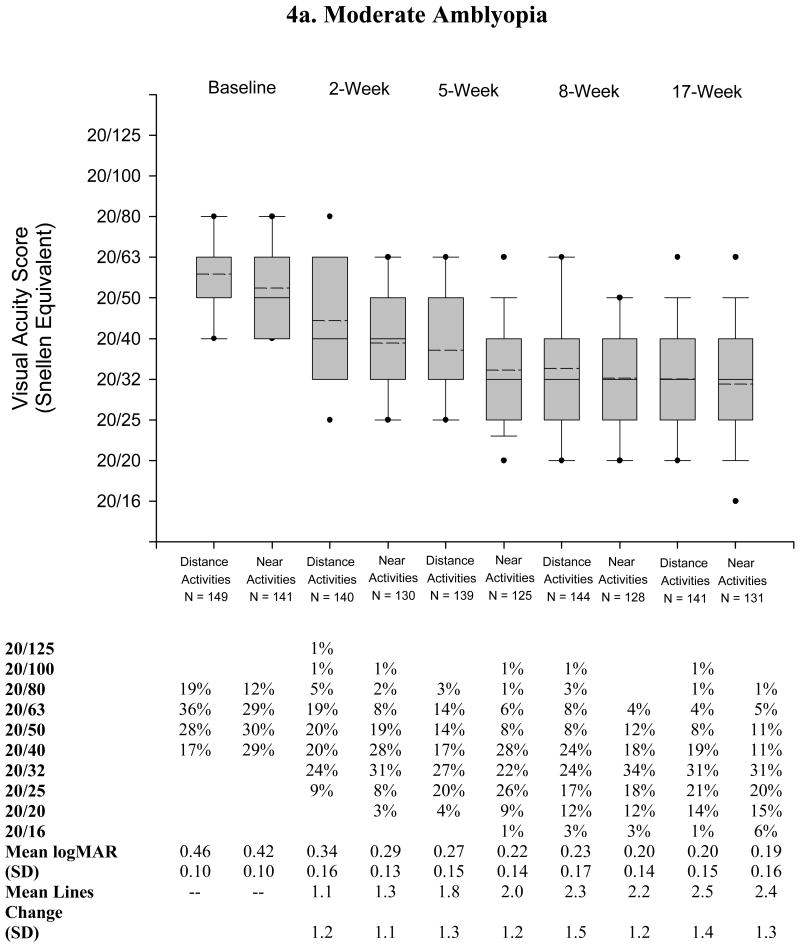
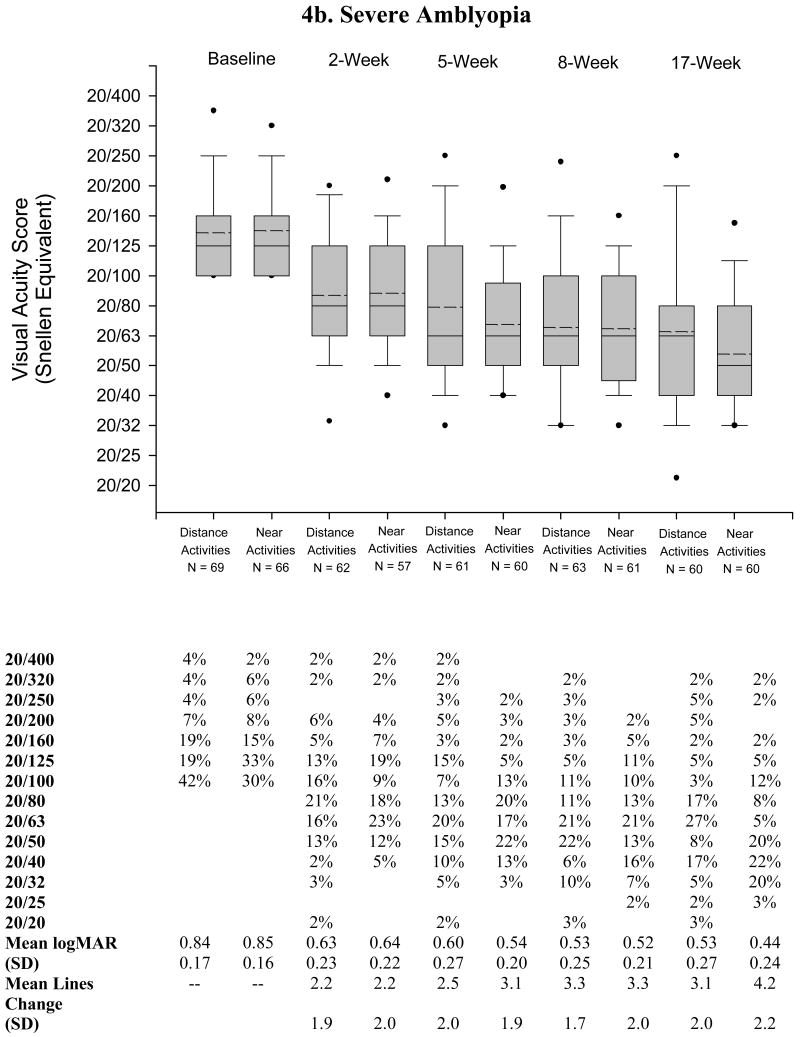
Figure 4. Amblyopic Eye Visual Acuity in Each Group at Baseline, 2 Weeks, 5 Weeks, 8 Weeks, and 17 Weeks By Severity.
Amblyopic eye visual acuity in each treatment and amblyopia severity group at baseline, 2 weeks, 5 weeks, 8 weeks, and 17 weeks. Box-whisker plot demonstrating mean (dashed horizontal line), median (solid horizontal line), 25 – 75th percentiles (extremes of the box), 10-90th percentiles (whiskers), and 5-95th percentiles (solid circles) of visual acuity at the visit. (logMAR = logarithm of minimum angle of resolution)


