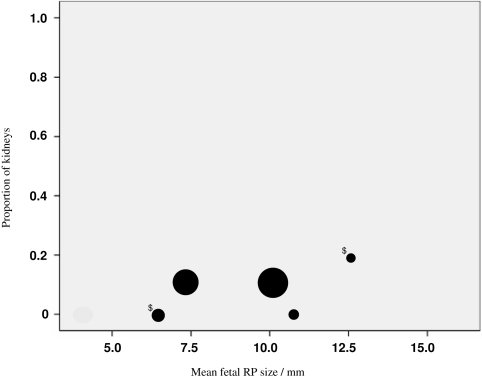
Figure 8.
Proportion of kidneys diagnosed with VUR. Unfilled circles represent routine studies, and filled (black) circles represent cohorts that included referred patients. Area of circles is proportional to group sample size for all the kidney data. $ represents the subgroups within the same study.

