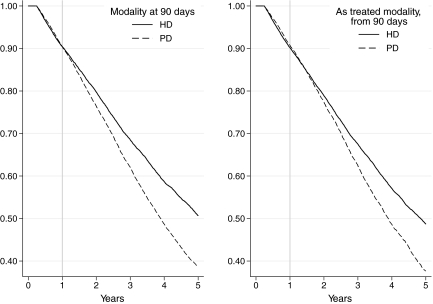
Figure 1.
Kaplan-Meier survival curves, censored at transplantation, by RRT modality at 90 d (left) and as-treated modality, from 90 d. In the as-treated analyses, patients moved between groups at the date of treatment modality change. We then calculated the survivor function using the risk group at the point of each failure event.

