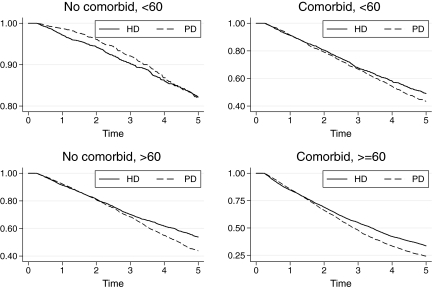
Figure 5.
Kaplan-Meier graph by modality of treatment at 90 d, by presence of any comorbidity and age group at RRT start. ▴, Risk (95% CI) for death within 12 mo of RRT start; •, risk for death ≥12 mo after dialysis start. Graphs are adjusted for vintage (to year 2000) and gender (to equal male and female numbers). Note that the y axes differ between panels.

