Figure 1.
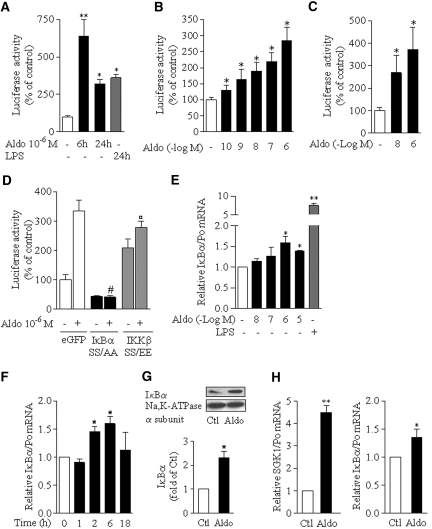
Aldosterone stimulates NF-κB transcriptional activity via an IKKβ- and IκBα-dependent pathway in CD principal cell lines. (A through C) mpkCCDcl4 (A and B) or mCCDcl1 (C) cells were transfected with NF-κB–dependent luciferase reporter gene (pLuc-NF-κB). Transfected cells seeded on polycarbonate filters were incubated in the absence or presence of aldosterone (Aldo) or 100 ng/ml of LPS from Escherichia coli before measurement of luciferase activity. (A) Time-dependent effect of 10−6 M aldosterone on NF-κB–dependent luciferase activity. (B and C) Dosage-dependent effect of 6-h aldosterone treatment on NF-κB–dependent luciferase activity. (D) Effect of constitutive inhibition or activation of NF-κB. mpkCCDcl4 cells transiently co-transfected with pLuc-NF-κB and eGFP, super-repressor IκBα SS/AA or constitutionally active IKKβ SS/EE mutants were grown on polycarbonate filters before measurement of luciferase activity. Results are expressed as a percentage of control (untreated cells in A, B, and C and untreated eGFP transfected cells in D). Bars are means ± SEM from three to six independent experiments. *P < 0.05 and **P < 0.001 versus control values; #P < 0.001 versus aldosterone-stimulated eGFP vector; °no significant difference versus nonstimulated IKKβ SS/EE vector. (E through G) Aldosterone upregulated IκBα expression. mCCDcl1 grown to confluence on polycarbonate filters (E and F) or on plastic support (G) were treated with aldosterone (Aldo) or 100 ng/ml LPS or left untreated (Ctl). IκBα mRNA was detected by RT-PCR (E and F), and IκBα protein was detected by immunoblot (G). (E) Dosage-dependent induction of IκBα mRNA expression by 6-h treatment with aldosterone. (F) Time-dependent induction of IκBα mRNA expression in cells treated with 10−6 M aldosterone. Results are expressed as fold of control values set to 1. Bars are means ± SEM from four independent experiments. (G) Representative immunoblot showing the increased abundance of IκBα protein in cells stimulated by 10−6 M aldosterone for 6 h. Na-K-ATPase α-subunit was taken as a loading control. The bar graph represents the densitometric quantification of IκBα immunoreactivity, expressed as fold of control level. Data are means ± SEM from four independent experiments. *P < 0.05 versus Ctl. (H) Isolated rat CCD were incubated for 2 h with or without 10−8 M aldosterone. SGK1, taken as a positive control of aldosterone effect and IκBα mRNA was detected by RT-PCR. Bars are means ± SEM from 12 experiments. *P < 0.05 versus Ctl.

