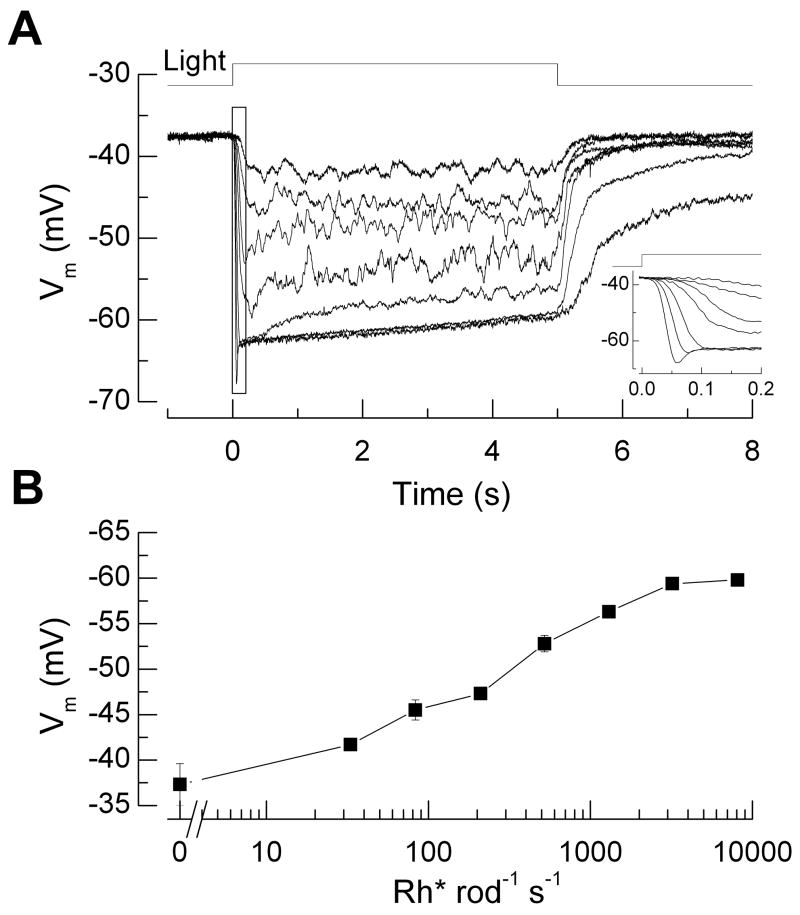
Figure 2.
Perforated-patch current-clamp recordings of membrane potential from mouse rod photoreceptors in dark-adapted retinal slices. (A) Response waveforms to 5 s light steps of intensities 33, 83, 210, 520, 1300, 3200, and 8100 Rh* rod−1 s−1. Data from 8 cells were averaged individually for each background light intensity and were corrected for a measured liquid junction potential of ~10 mV. Average input resistance was 5 GΩ and average access resistance, 300 MΩ. Inset: Same responses at higher temporal resolution showing rapid relaxation or “nose” in voltage waveform at high light intensities caused by activation of ih. (B) Response-intensity curve of voltage response, averaged during the interval 4.5–5 s from the responses in A, as function of steady light intensity. Methods: Experiments were conducted in accordance with protocols approved by institutional IACUC committees. Light-evoked membrane potential changes during current-clamp recordings were measured in response to background light steps of 5 sec duration delivered from an LED (λmax ~ 470 nm). To estimate the number of rhodopsin molecules activated per flash, we measured the light intensity of a 520 μm spot focused on the slice preparation by the 20X 0.75NA (Nikon) condenser objective using a calibrated photodiode (United Detector Technologies, San Diego, CA). Light intensities were converted to equivalent 501 nm photons by convolving the power-scaled spectral output of the LED with the normalized spectral sensitivity curve for mouse rhodopsin. These were then converted to Rh* s−1 by estimating the collecting area of rod photoreceptors in the experimental setup. Dim flashes were delivered during suction electrode recordings from rod outer segments in clusters [42], and the mean Rh* per rod was determined from the scaling of the time-dependent variance to the mean response [43]. Based on these factors we estimated the rod collecting area in the experimental setup to be 0.18 μm2 (n = 6 rods).

