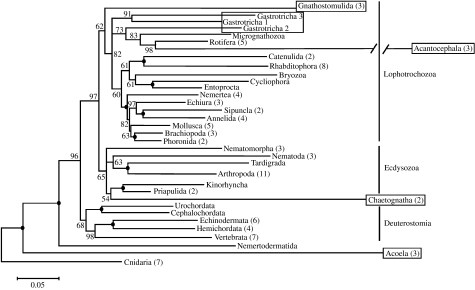
Figure 2.
Bayesian analysis of 18S+28S sequences (3696 nts) from 106 metazoan representatives with Cnidaria as the outgroup. Posterior probabilities are indicated when less than 100%, otherwise a bullet is present on the node. Phyla are collapsed and numbers in parentheses indicate the number of taxa sampled if more than one. The monophyly of each phylum has maximum support (except for gastrotrichs). Boxed groups correspond to long-branched or problematic groups for which specific analyses were carried out (see electronic supplementary material). The scale bar indicates the number of changes per site.

