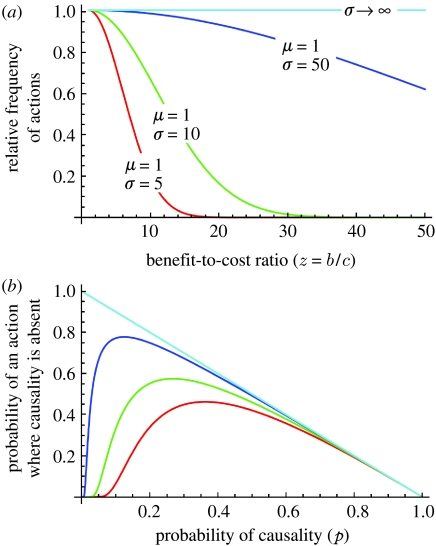
Figure 2.
(a) Gaussian relative frequency distributions of actions as a function of their benefit-to-cost ratio (z). Distributions have mean μ and standard deviation σ. (b) Probability of an action evolving that predicts a latter event that does not occur, as a function of p (the probability that the prior and latter events are causally associated). The different plots are for the different probability density distributions of the benefit-to-cost ratio shown in (a). The line for σ→∞ corresponds to all benefits from actions being equally likely, which reduces the relative frequency of incorrect responses to simply (1−p) (figure 1).

