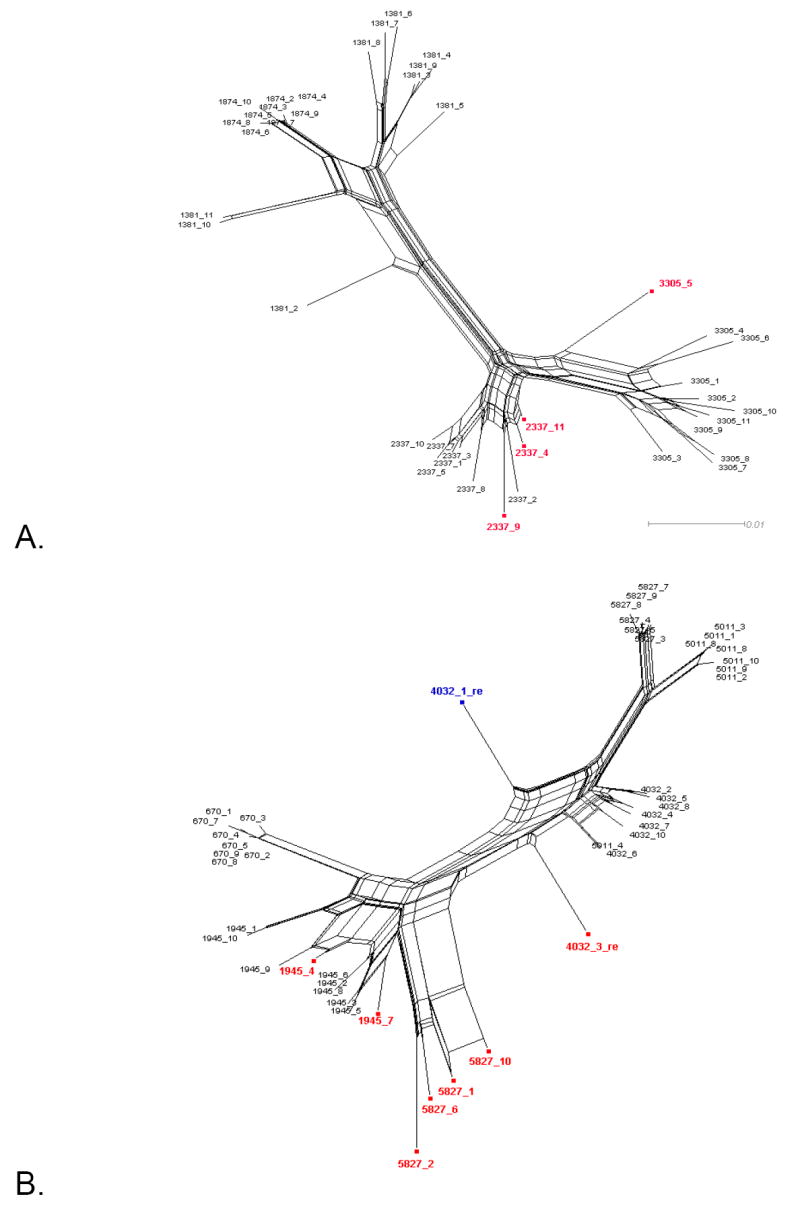
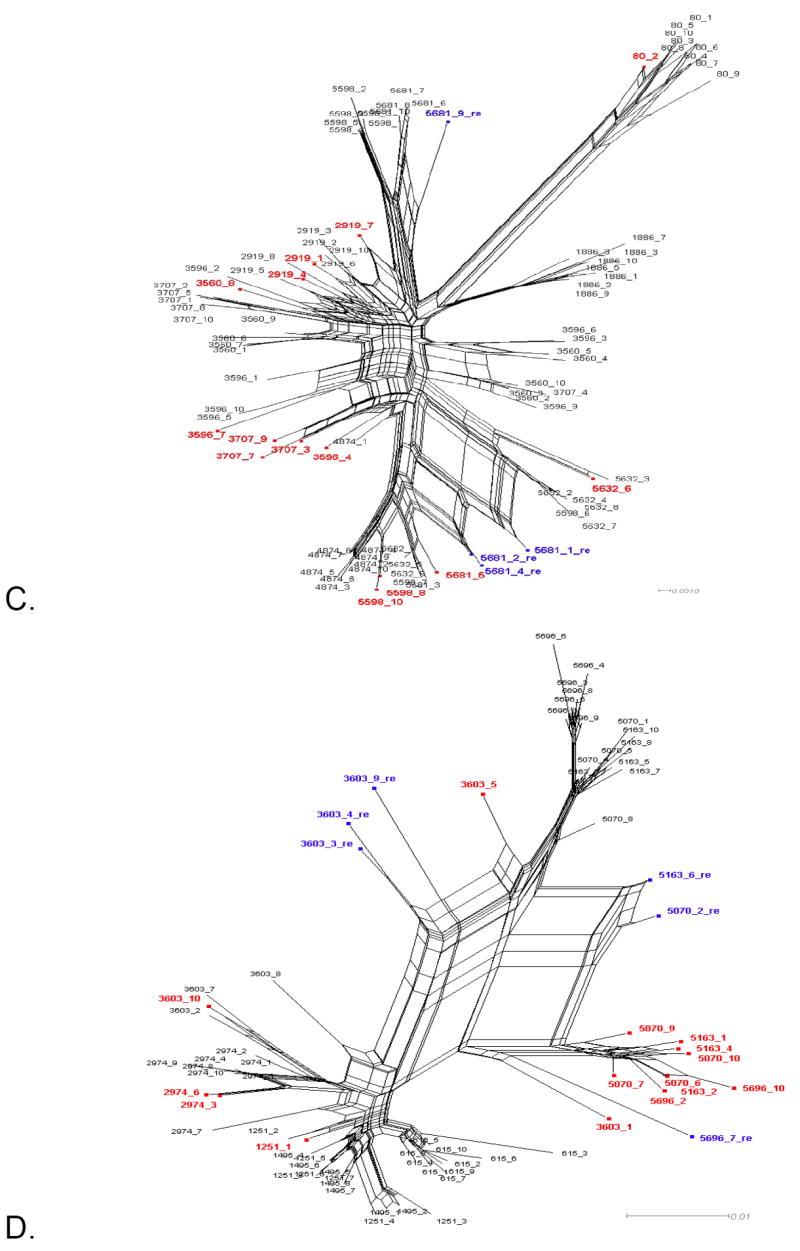
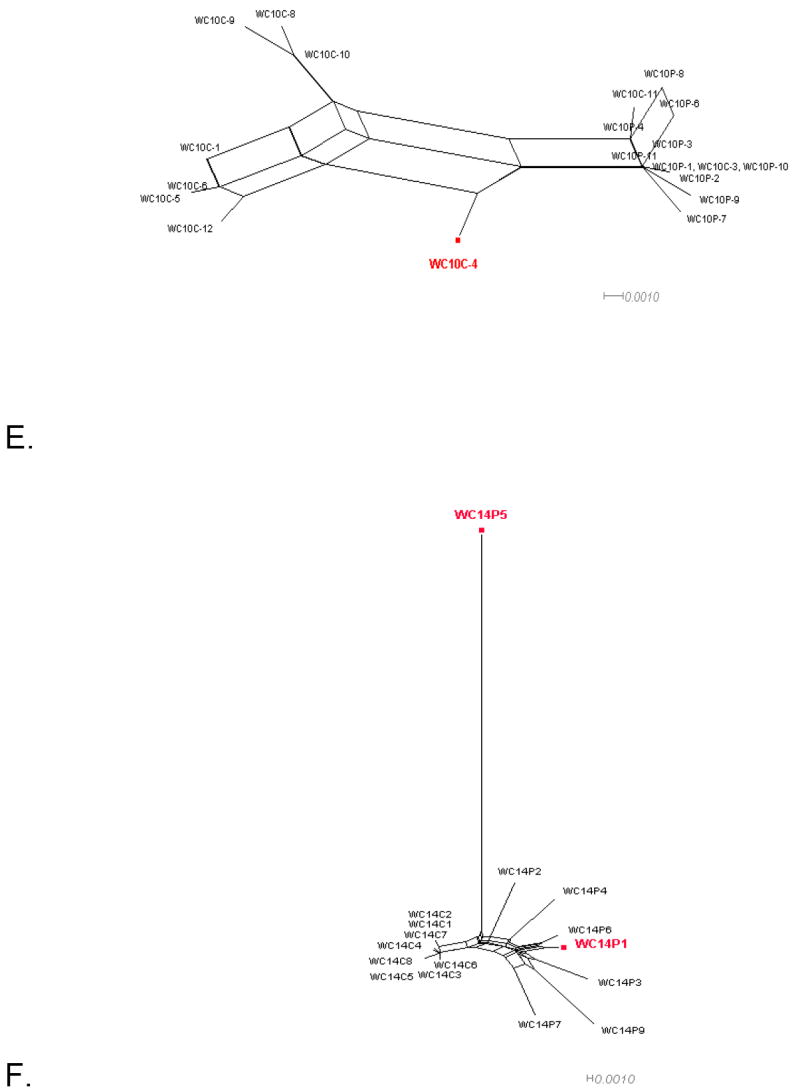
Figure 1. Phylogenetic networks for different HIV-1 data sets.


Neighbor-Nets (NNets) obtained with the split-decomposition method and uncorrected p-distances for different HIV-1 intra-patient data sets. Branch lengths are drawn to scale with the bar at the bottom indicating 0.01 nucleotide substitutions per site. Panels A-D include data sets from Mild et al. (2007). Panels E-F data sets from Philpott et al. (2005). Sequences identified as recombinant in the previous study are shown in blue; sequences identified as additional recombinants in this study in red. A. Patient 1865. B. Patient 2239. C. Patient 2242. D. Patient 2282. E. Patient WC10 F. Patient WC14.
