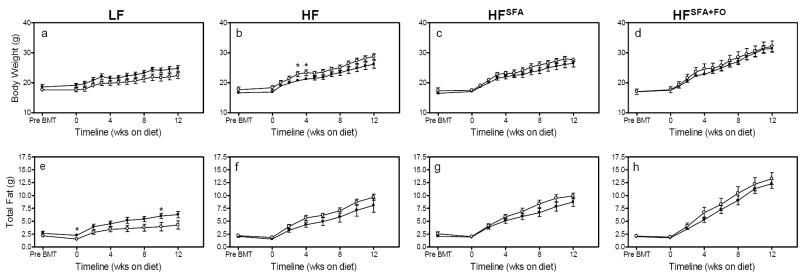
Figure 1. Total body weight and fat over 12 wks of diet.
Body weight was measured every week and total body fat was measured every other week using NMR in mice that had received either TLR4+/+ (black bars) or TLR4-/- (white bars) marrow and had been fed LF diet (A & E), HF (B & F), HFSFA diet (C & G), and HFSFA+FO diet (D & H). Data are expressed as the mean ± SEM from 5-11 mice per group. *P<0.05.

