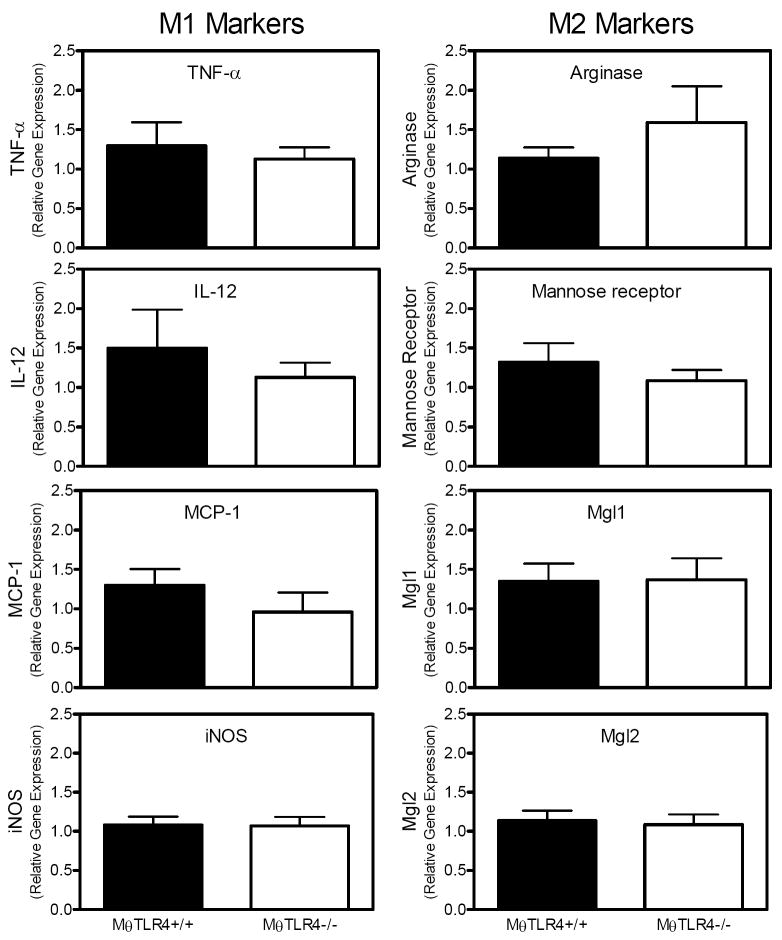
Figure 5. M1 and M2 classification of ATMs.
Markers of M1 and M2 macrophages were determined in WAT by analyzing gene expression for TNF-α, IL-12, MCP-1, iNOS, arginase, mannose receptor, Mgl1, and Mgl2 (M1 versus M2 as indicated on figure). Mice receiving TLR4+/+ marrow are shown in black bars and those receiving TLR4-/-marrow are shown in white bars. Data are shown only from mice fed the LF diet and are expressed as mean ± SEM from 5-11 mice per group.

