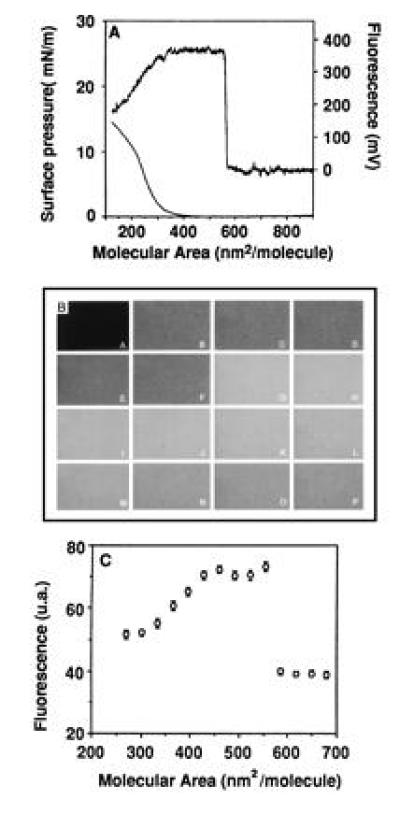
Figure 2.

Fluorescence emission change of FITC-BSA films on the air/water interface upon compression. The film was compressed after spreading the protein solution by a slow lateral movement of a Teflon barrier. The subphase was 1 M NaCl/1 mM Mops, pH 7.3. The protein molecular area was obtained from the spread volume. By comparing with previous data (20), it was concluded that only 33% of the proteins remained at the interface by this spreading procedure. (A) The detection was obtained by a photomultiplier tube on an interface fluorimeter specially designed for monolayer investigation (5). (B) The detection was obtained on an inverted microscope (Leitz, H3 block filter, 32 × objective) by epifluorescence using video detection (Lhesa camera, Optimas software). (A) Free air/water interface. (B–P) Compression of the film (B, 730 nm2/mol; C, 680 nm2/mol; D, 650 nm2/mol; E, 617 nm2/mol; F, 586 nm2/mol; G, 554 nm2/mol; H, 523 nm2/mol; I, 491 nm2/mol; J, 460 nm2/mol; K, 428 nm2/mol; L, 397 nm2/mol; M, 365 nm2/mol; N, 334 nm2/mol; O, 302 nm2/mol; P, 271 nm2/mol). Micrograph was scanned with a SprintScan 35 (Polaroid) and printed using a XLS 8600 PS printer (Kodak). (C) The emission detected in B was quantified by pixel averaging (4 × 4, sampling 30).
