
Figure 4.
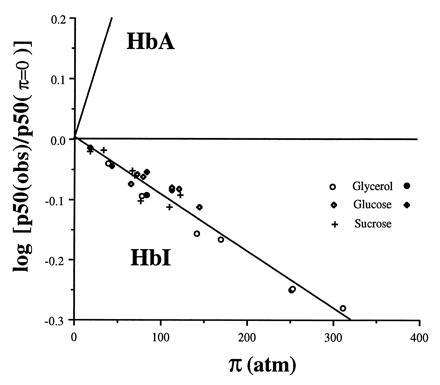
Plot showing the dependence of oxygen affinity with osmotic pressure for HbI and human hemoglobin (HbA). The value of p50 at π = 0 was estimated from measurements in buffer alone. The line showing dependence for human hemoglobin is obtained from Colombo et al. (25). Data points are shown for tonometer measurements with glycerol (○), glucose (⋄), and sucrose (+) solutions and Hem-O-Scan measurements for glycerol (•) and glucose (♦). Note the opposite direction for HbI, in which osmotic pressure increases oxygen affinity, compared with HbA, for which osmotic pressure decreases oxygen affinity. The slope of the least squares fit of the HbI data is −9.5 × 10⁻⁴ ± 0.5 atm−1, which indicates that an additional 6.2 ± 0.3 water molecules are bound to the deoxy state relative to the oxy state.