Figure 6.

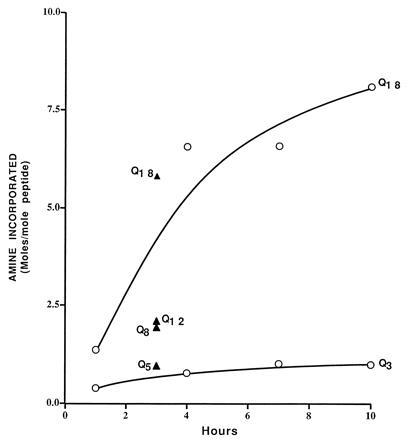
Reactivity of R5QnR5. For Q3 and Q18, the incorporation was measured after different incubation times (○). For intermediate values of Qn, values are plotted for a single incubation time of 3 h (▴).

Reactivity of R5QnR5. For Q3 and Q18, the incorporation was measured after different incubation times (○). For intermediate values of Qn, values are plotted for a single incubation time of 3 h (▴).