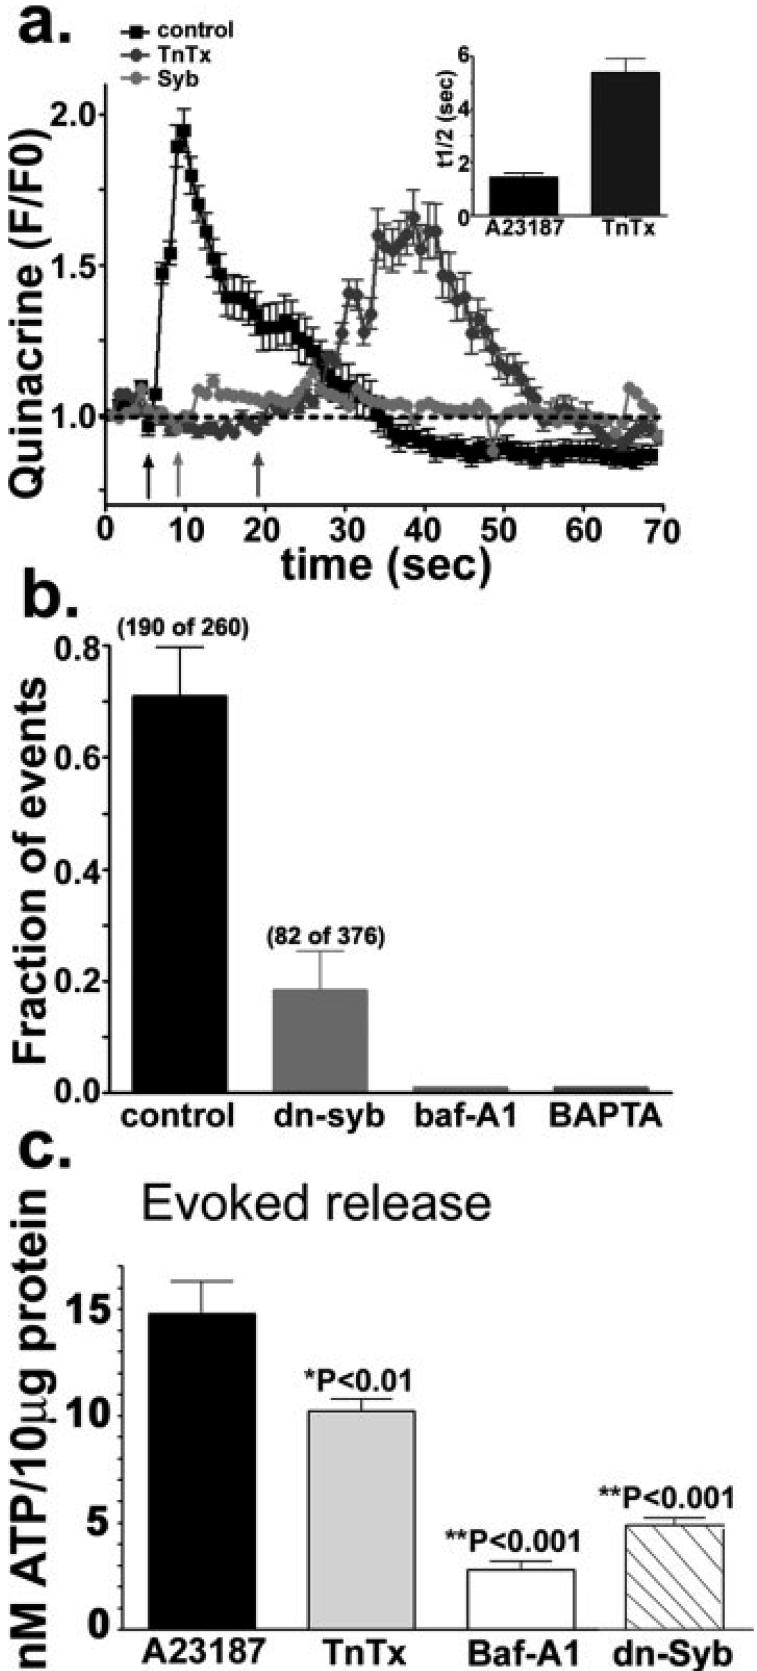
Fig. 4.
vSNARE-dependent release of quinacrine and ATP. (a) Time course of quinacrine fluorescence intensity (F/F0) changes induced by 10 μM A23187 (arrows) in 3-4 day-adherent untreated (black squares), TnTx-treated (300 nM; dark gray circles) and dn-syb2-transfected (light gray circles) progenitor cells. Inset: Bar histograms show the mean ± SEM values of the half-time (t1/2) of the rising phase of quinacrine fluorescence intensity, defined as the interval between the emergence of quinacrine vesicles into the evanescent field and the moment at which their fluorescence intensity started decreasing, in control and TnTx-treated progenitors. (b) Bar histograms show that the fraction of exocytic events recorded from progenitors transfected with the dominant-negative domain of synaptobrevin-2 (dn-syb) was greatly reduced and that these events were absent in progenitor cells treated with either bafilomycin-A1 (5 lμM; baf-A1) or a calcium chelator (50 lμM; Bapta-AM). (c) The amount of ATP released from 4-day progenitors exposed to the Ca2+-ionophore was significantly reduced by both TnTx (300 nM) and bafilomycin-A1 (5 μM; Baf-A1), and by transfecting the cells with the dominant-negative domain of synaptobrevin-2 (dn-Syb). Values are mean ± SEM. *P < 0.01; **P < 0.001; ANOVA followed by Newman-Keuls' paired test.

