
Figure 3. Spatial mapping and lifetime of EGFP-PMN in the wound.
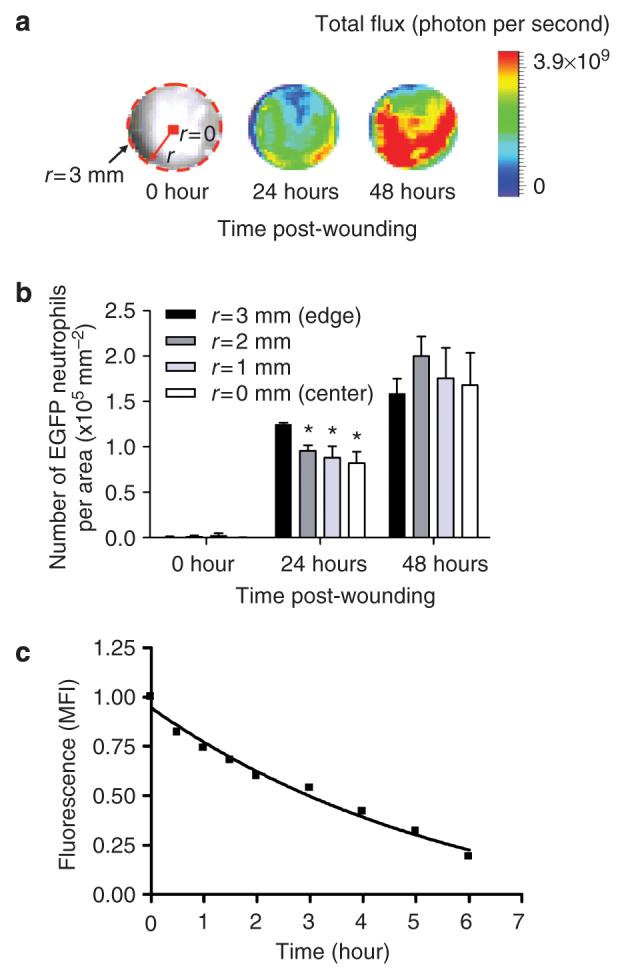
(a) Representative fluorescent image of GFP intensity (photon per second per cm2 per sr) emitted from infiltrated EGFP-PMN in circular (3 mm in radius) full thickness wound at 0, 24, and 48 hours after wounding. Where r and dotted line indicate radius and boundary of wound edge, respectively. (b) Dynamic changes in number of EGFP-PMN per area at regions from edge (r=3 mm) to center (r=0) within wound area at 0, 24, and 48 hours after wounding (n=3). *Significant difference between r=3 vs r=2, r=1, and r=0mm (P<0.05). (c) Ex vivo time-dependent decay of GFP fluorescence emitted from bone marrow-isolated EGFP-PMN (1×10⁶ cells) on back skin wound of WT mice. Fluorescence intensity in the presence of EGFP-PMN was normalized to the value before application (normalized fluorescence intensity=1.136 exp(-0.17t)-0.1892). Data are expressed as mean±SEM.