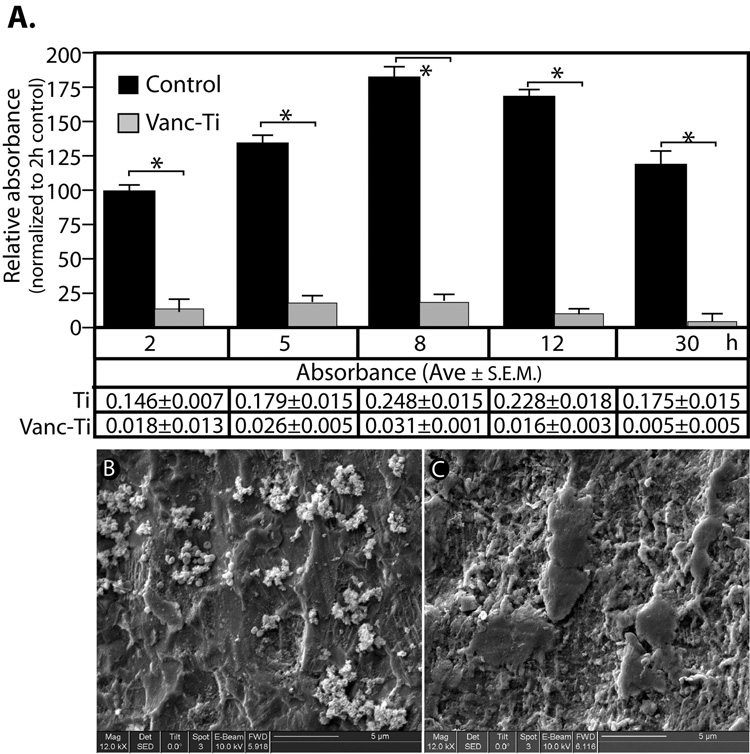
Figure 2. Biofilm formation on Vanc-Ti surfaces.
(A) Absorption of crystal violet was used as an indicator of biofilm formation by S. epidermidis. The relative absorption of the crystal violet value was normalized to the 2h control. Control surfaces consistently showed significantly more crystal violet incorporation than the Vanc-Ti surfaces. At 8 and 12 h, crystal violet incorporation achieved maximum values on the control surfaces, while the Vanc-Ti surface showed no change in staining intensity with time. The absorbance values of the crystal violet are shown below each bar of the histogram. The absorbance values on the Vanc-Ti rods were near baseline values, indicating no biofilm formation. (* p<0.05). SEM analysis: Twenty-four hours after a challenge with S. epidermidis, Vanc-Ti and control rods were imaged by SEM. Both surfaces were passivated in order to achieve similar levels of surface activation. Control surfaces show extensive colonization by round staphylococci encased in a matrix that suggests biofilm formation (B). In contrast, the Vanc-Ti surface is devoid of such colonization, with a few single bacterial-like particles observed (C). Magnification: bar = 5 µm

