Figure 2.
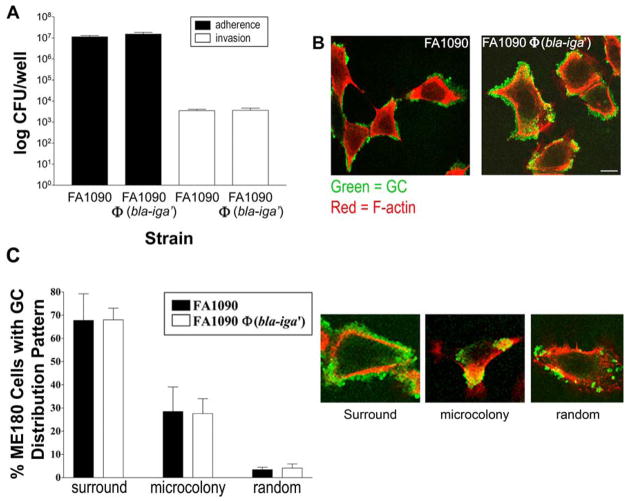
FA1090Φ(bla-iga′) and FA1090 interact with ME180 cells in a similar manner. (A) ME180 cells were incubated with GC at a MOI 10 for 6 h at 37°C, 5% CO2 and then incubated for 2 h in media alone to quantify adherent GC (black bars) or media containing gentamicin (200 μg/ml) to quantify internalized GC (white bars). Cells were lysed and lysates were plated by serial dilution for viable GC plate count. Shown are representative data of three independent experiments performed in triplicate (±SD). (B) ME180 cells were incubated with GC for 6 h.. Extracellular GC were stained with an Oregon green-conjugated anti-GC Ab and F-actin was stained with Alexa Fluor 546-labeled phalloidin prior to analysis via LSCM. Bar, 10 μm. (C) FA1090 (black bars) and FA1090Φ(bla-iga′) (white bars) from (B) were scored on their cellular distribution patterns on a total of approximately 300 randomly selected ME180 cells. GC distributions were scored as layers of GC surrounding the cell (surround), microcolon(ies) on the cell (microcolony), or randomly distributed individual GC or small clusters (random). The LSCM images provide a visual representation of each distribution. Data represent the average (± SD) percentage of ME180 cells that display each distribution from three independent experiments. Pil+Opa+ GC were used in all trials.

