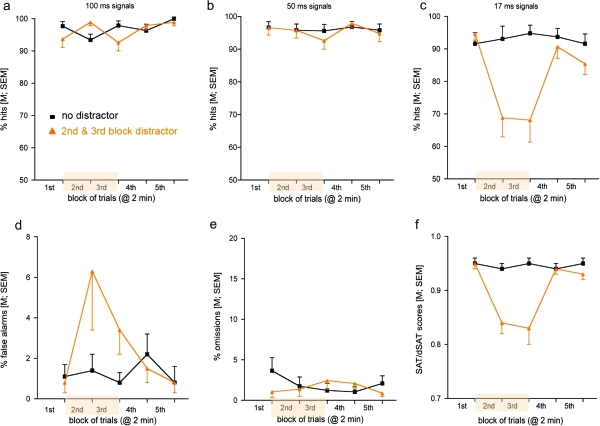
Fig. 3.
SAT/dSAT Performance of Healthy Human Volunteers. Except for different signal durations and longer trial blocks, this figure allows direct comparisons with the data from rats illustrated in figure 2 (data taken from E. Demeter, M. Sarter, C. Lustig (personal communication); see legend of figure 2 for more details).

