
Fig. 5.
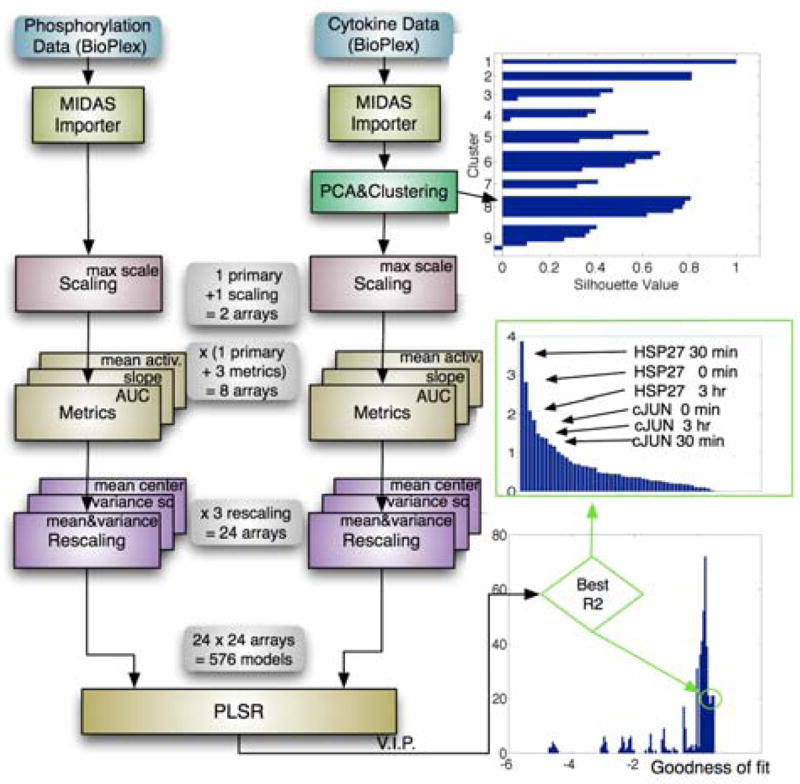
PLSR analysis in DataRail. Liver CSR data was imported to DataRail and values for protein phosphorylation designated as inputs and levels of secreted cytokine as outputs. The data was not normalized with respect to total protein concentration, to not introduce additional experimental error. The extent of cytokine co-expression was determined using internal PCA and k-means clustering routines. This yielded as set of 5 tightly clustered cytokines that were used as outputs for modeling (see row 1 of Table S1 for information about the dimensionality of the data). Primary data and data scaled with respect to maximum signal were then analyzed to compute area under the curve, slope, and mean change; this generated 8 transformed arrays for both input and output data. The resulting arrays were rescaled using routines for mean-centering, variance-scaling, or both combined (auto-scaling). The resulting 24 input cubes and 24 output cubes gave rise to 576 PLSR models, which were ranked according to their goodness of fit. For the best model, the variable importance of projection (VIP) is shown as a way to assess the relative importance of different inputs for cytokine secretion.