
FIG. 5.
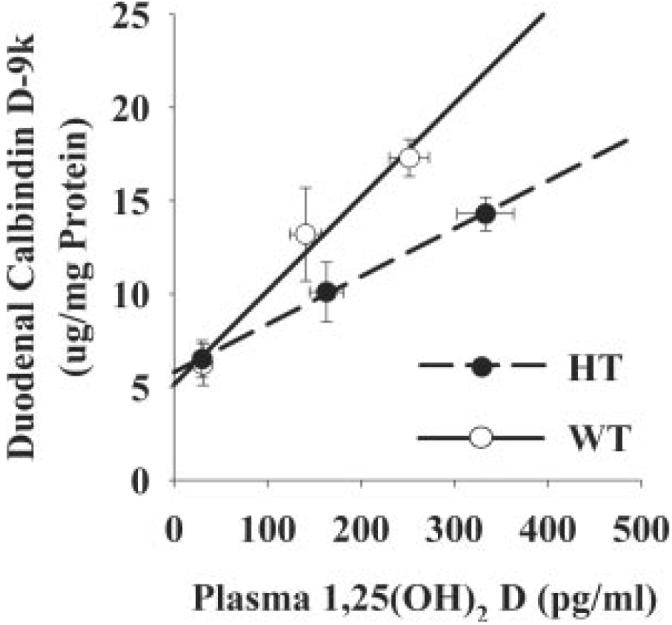
Effect of VDR level on the relationship between calbindin D9k protein levels and plasma 1,25(OH)2 D3 levels. Ninety-day-old mice were fed diets containing different levels of calcium (0.5% Ca, 0.02% Ca, or 2.0% Ca) for a 7-d period before the experiment to modulate plasma levels of 1,25(OH)2 D3 in the mice (n = 5 males/diet group). Calbindin D9k values and plasma 1,25(OH)2 D3 data were plotted by individual mouse or, as shown in the figure, by the mean value for each diet and genotype group, and regression analysis was conducted. Regression lines are presented by solid (WT) or dashed (HT) lines. WT calbindin D9k = 0.046 * 1,25(OH)2 D3 + 5.1 (r2 = 0.76 for individual data points, r2 = 0.98 for means); HT calbindin D9k = 0.026 * 1,25(OH)2 D3 + 5.8 (r2 = 0.51 individual/r2 = 0.99 means, WT vs. HT slope, P = 0.054).