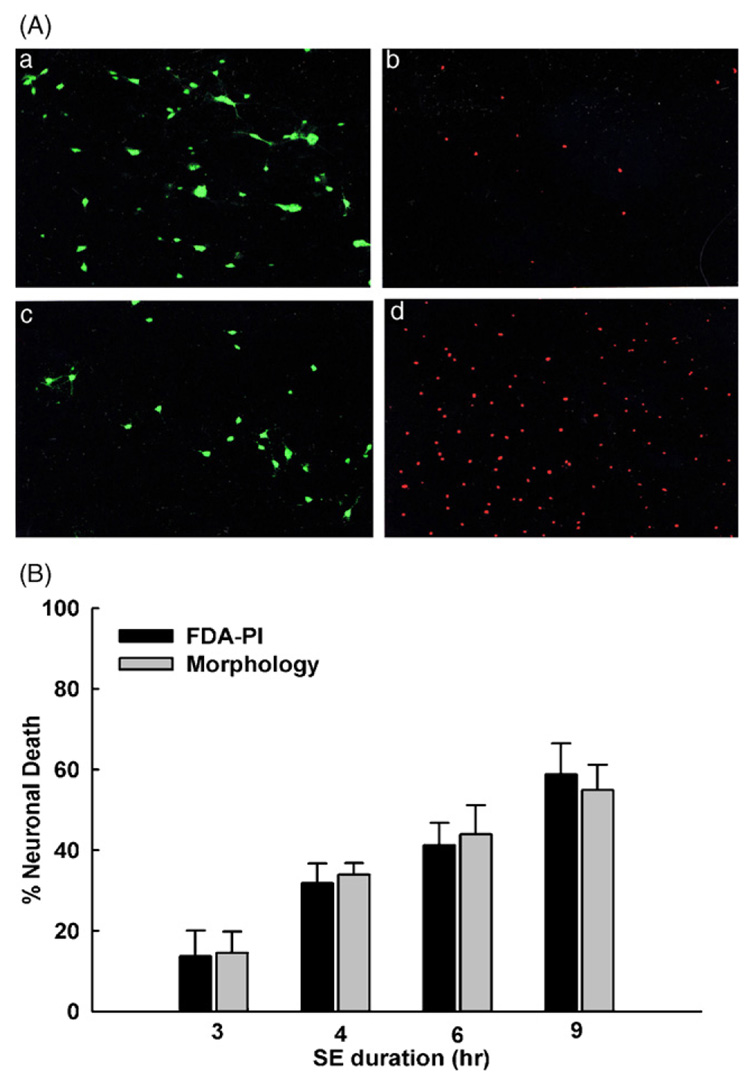
Figure 2. Neuronal cell death as a function of seizure duration.
(A) Representative images of neurons at 0 and 12 h of low Mg2+-induced high-frequency spiking. Frame a: FDA staining of viable neurons at 0 h (n = 49). Frame b: PI staining of nuclei of non-viable neurons in the same field as (a) at 0 h. Frame c: FDA staining of viable neurons at 12 h of low Mg2+ exposure (n = 32). Frame d: PI staining of non-viable neurons in the same field as (c) at 12 h of low Mg2+ exposure. (B) Comparison of neuronal cell death after 3, 4, 6 and 9 h exposure to low Mg2+ solution (abbreviated SE in the figure). Percentage neuronal cell death is dependent on the duration of exposure to low Mg2+ solution in culture. Gray bars represent cell death assessed by visual examination of neuronal morphology. Black bars indicate cell death examined using FDA–PI intra-vital staining as described in section ‘Materials and Methods’. Differences between the two techniques were not statistically significant (paired t-test). FDA–PI staining was performed 24 h after exposure to low Mg2+ solution for these studies.

