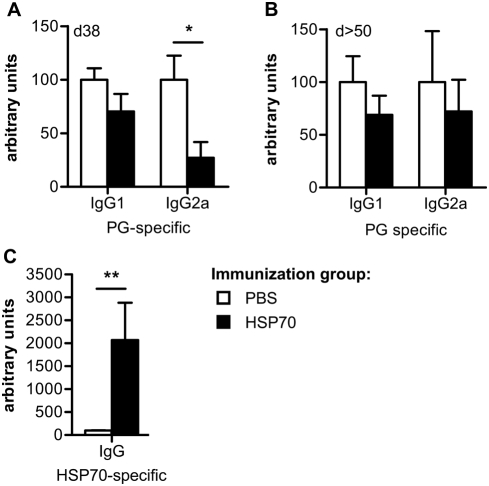
Figure 3. Altered PG- and HSP70-specific B cell responses in HSP70 immunized mice.
Proteoglycan (PG)- or heat shock protein 70 (HSP70)-specific antibody production in the sera of mice was assessed by ELISA and relative serum antibody levels were calculated as OD relative to the OD measured for a standard of pooled sera. (A–B) PG-specific IgG1 and IgG2a levels were determined (A) on day 38 and (B) on day 50 or 64 after disease induction. (C) HSP70-specific total IgG production was measured in sera obtained on day 38. Values in A and C represent the mean±SEM (n = 5 mice in each group) and are representative for three independent experiments (PG-specific IgG) or one experiment (HSP70-specific IgG). Values in B represent mean±SEM (n = 6 mice) of sera obtained on either day 50 or day 64, no obvious difference between sera collected on day 50 or 64 was detected. Open bars show the PBS immunized group and filled bars the HSP70 immunized group. Significant difference (* p<0.05 or **p<0.01, Mann-Whitney U Test) is indicated by the asterisk.

