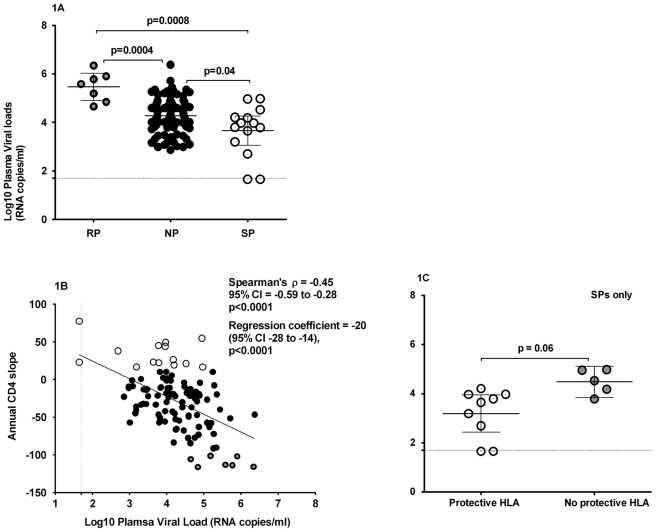
Figure 1. Evaluation of relationship between HIV disease progression and viral loads.
CD4 slopes were computed by multilevel regression modelling of six-monthly retrospective participant CD4 counts. The median observation time over which CD4 slopes were calculated was 61 months (minimum 18 and maximum 97) months. Plasma viral load was quantified using Bayer™ bDNA assay according to the manufacturer's protocol; the plasma viral load minimum detection threshold was 50 RNA copies/ml. Figure 1A illustrates the relationship between CD4 slopes and viral loads, ○denotes RPs, • are NPs; while ⊙are SPs; 1B compares mean viral loads between groups while figure 1C compares plasma viral loads in SPs who had HLA alleles known to be protective as previously described and to those who did not. The lines running parallel to the Y and X axis (figures 1A and 1B respectively) indicate the minimum detection limit for evaluation of plasma viral loads. For purposes of statistical analyses and graphical representation of the data, undetectable plasma viral loads were assumed to equate to 45 RNA copies per ml.

