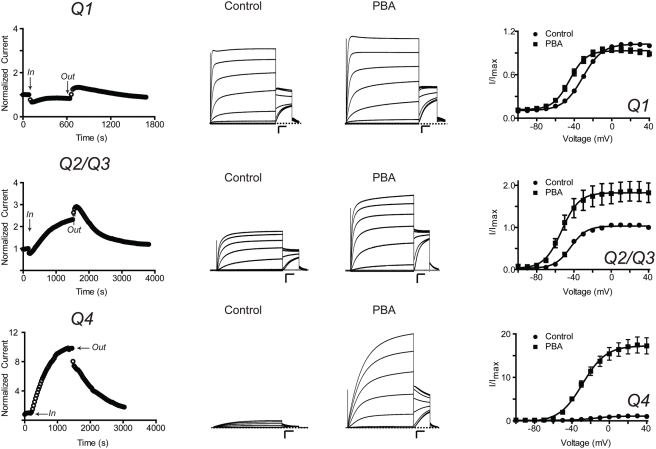
Figure 3. PBA activates all tested members of the KCNQ family.
Left panel: Time courses of current recorded in ND96 at +40 mV at the end of a 2 s pulse. The current was normalized before PBA application. PBA initially inhibits and then slowly potentiates Q1 and Q2/Q3 current. PBA only activates Q4 channels. Middle panel: Families of currents recorded before and during treatment with PBA. Currents were elicited by 4 s test potentials from −100 to +60 mV in 10 mV increments from a holding potential of −80 mV followed by a tail pulse to −30 mV. Dashed line indicates zero current. Scale bars represent 1 µA and 0.5 s. Right panel: Voltage-activation curves calculated from tail current analysis. Solid curves represent Boltzmann fits to the data. Data are presented as the mean±SEM (n = 4–6).

