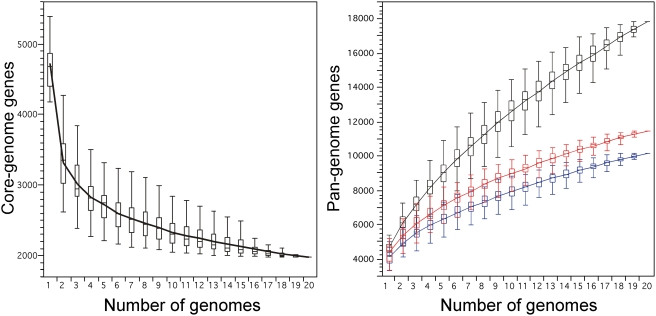
Figure 1. Escherichia coli core and pan-genome evolution according to the number of sequenced genomes.
Number of genes in common (left) and total number of non-orthologous genes (right) for a given number of genomes analysed for the different strains of E. coli. The upper and lower edges of the boxes indicate the first quartile (25th percentile of the data) and third quartile (75th percentile), respectively, of 1000 random different input orders of the genomes. The central horizontal line indicates the sample median (50th percentile). The central vertical lines extend from each box as far as the data extend, to a distance of at most 1.5 interquartile ranges (i.e., the distance between the first and third quartile values). At 20 sequenced genomes, the core-genome had 1976 genes (11% of the pan-genome), whereas the pan-genome had (i) 17 838 total genes (black), (ii) 11 432 genes (red) with no strong relation of homology (<80% similarity in sequence), and (iii) 10 131 genes (blue) after removing insertion sequence-like elements (3834, 21% of all genes) and prophage-like elements (3873, 22% of all genes).

