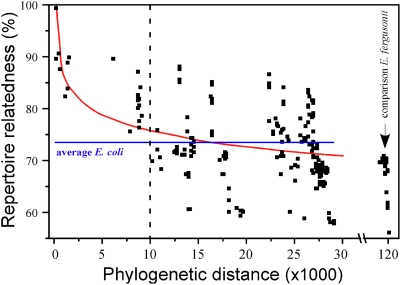
Figure 5. Association between gene repertoire relatedness and phylogenetic distance.
The horizontal line corresponds to the average relatedness among Escherichia coli/Shigella strains. The log fit shows an R2 = 0.26 (p<0.01), which drops to R2 = 0.07 (p<0.01) if the points before the dashed line are removed.

